
Chapter 8: Fear, Anxiety, and Stress
Fear: Cognitive Appraisals
Table 6
Mean Changes in Cognitive Appraisal Dimensions for Fear (Scherer, 1997)
| Cognitive Appraisal Dimension | Mean | Question | Response Scale |
|---|---|---|---|
| Expectedness | 1.48 | Did you expect this situation to occur? | 1 = not at all; 2 = a little; 3 = very much |
| Unpleasantness | 2.88 | Did you find the event itself pleasant or unpleasant? | 1 = pleasant; 2 = neutral; 3 = unpleasantness |
| Goal Obstruction | 2.32 | Did the event help or hinder you to follow your plans or achieve your aims? | 1 = it helped; 2 = it didn’t matter; 3 = it hindered |
| Unfairness | 1.92 | Was the situation unjust or unfair? | 1 = not at all; 2 = a little; 3 = very much |
| External causation | 2.45 | Who do you think was responsible for the event? | 1 = self/internal; 2 = close persons / external; 3 = other persons / external; 4 = impersonal agency / external |
| Coping Ability | 2.63 | How did you evaluate your ability to act on or to cope with the event and its consequences? | 1 = powerless; 2 = escape possible; 3 = pretending nothing happened; 4 = no action necessary; 5 = could positively influence event and change consequences |
| Immorality | 1.83 | Would this behavior itself be judged as improper or immoral by your acquaintances? | 1 = not at all; 2 = a little; 3 = very much |
| Self-esteem | 1.77 | How id this event affect your self-esteem? | 1 = negatively; 2 = not at all; 3 = positively |
Adapted from “The Role of Culture in Emotion-Antecedent Appraisal,” by K.R. Scherer, 1997, Journal of Personality and Social Psychology, 73(5), p. 905, 911 (The role of culture in emotion-antecedent appraisal.). Copyright 1997 by the American Psychological Association.
Figure 3
Eight Cognitive Appraisal Ratings for Fear across Six World Regions
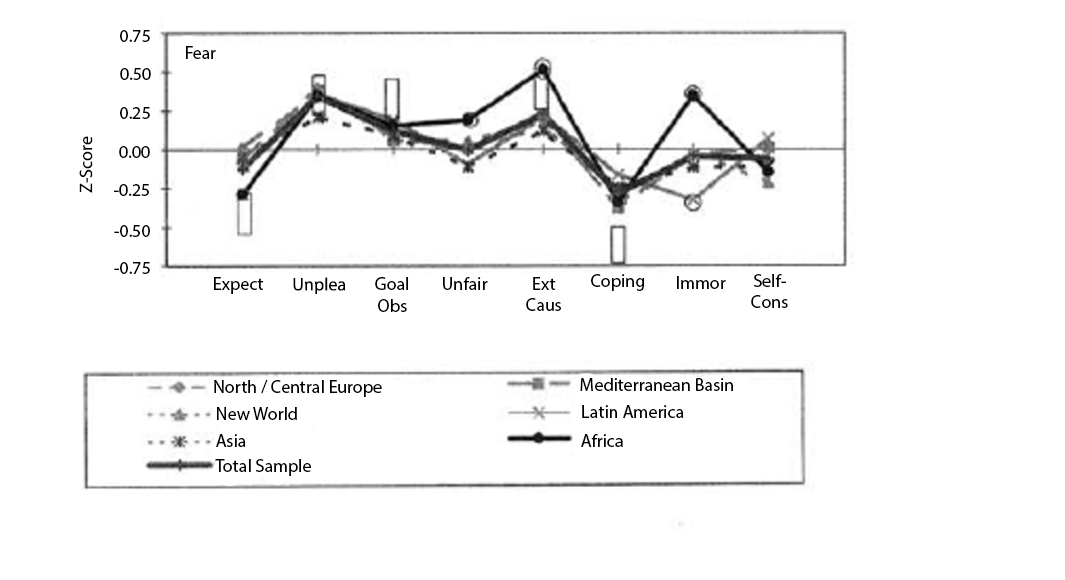
Note. Presence of a circle around a datapoint indicates that the country with the circle showed means significantly different from the mean of the remainder of the sample. Adapted from “The Role of Culture in Emotion-Antecedent Appraisal,” by K.R. Scherer, 1997, Journal of Personality and Social Psychology, 73(5), p. 912, (The role of culture in emotion-antecedent appraisal.). Copyright 1997 by the American Psychological Association.
