Chapter 14 – Emotion Regulation
Cultural Differences in the Consequences of Expressive Suppression
A recent study (Butler et al., 2007) investigated whether culture changes the consequences of suppression. In this study, female participants self-reported their cultural values on a scale that ranged from -3 – European values only to +3 – a combination of European and Asian values (called “bipolar values”). Cultural values were positively correlated with self-reported suppression, indicating that holding people who hold both Asian and American values have a tendency to engage in suppression. This means without being instructed, Asian American women will have a tendency to engage in expressive suppression. Figure 20 shows the relationship between tendency to suppress and the tendency to experiences negative emotion for women holding European values and women holding bi-cultural values. This findings shows that suppression does not significantly increase negative emotions for individuals who ascribe to bi-cultural values.
Figure 20
Influence of Trait Suppression and Self-Reported Cultural Values on Tendency to Experience Negative Emotions
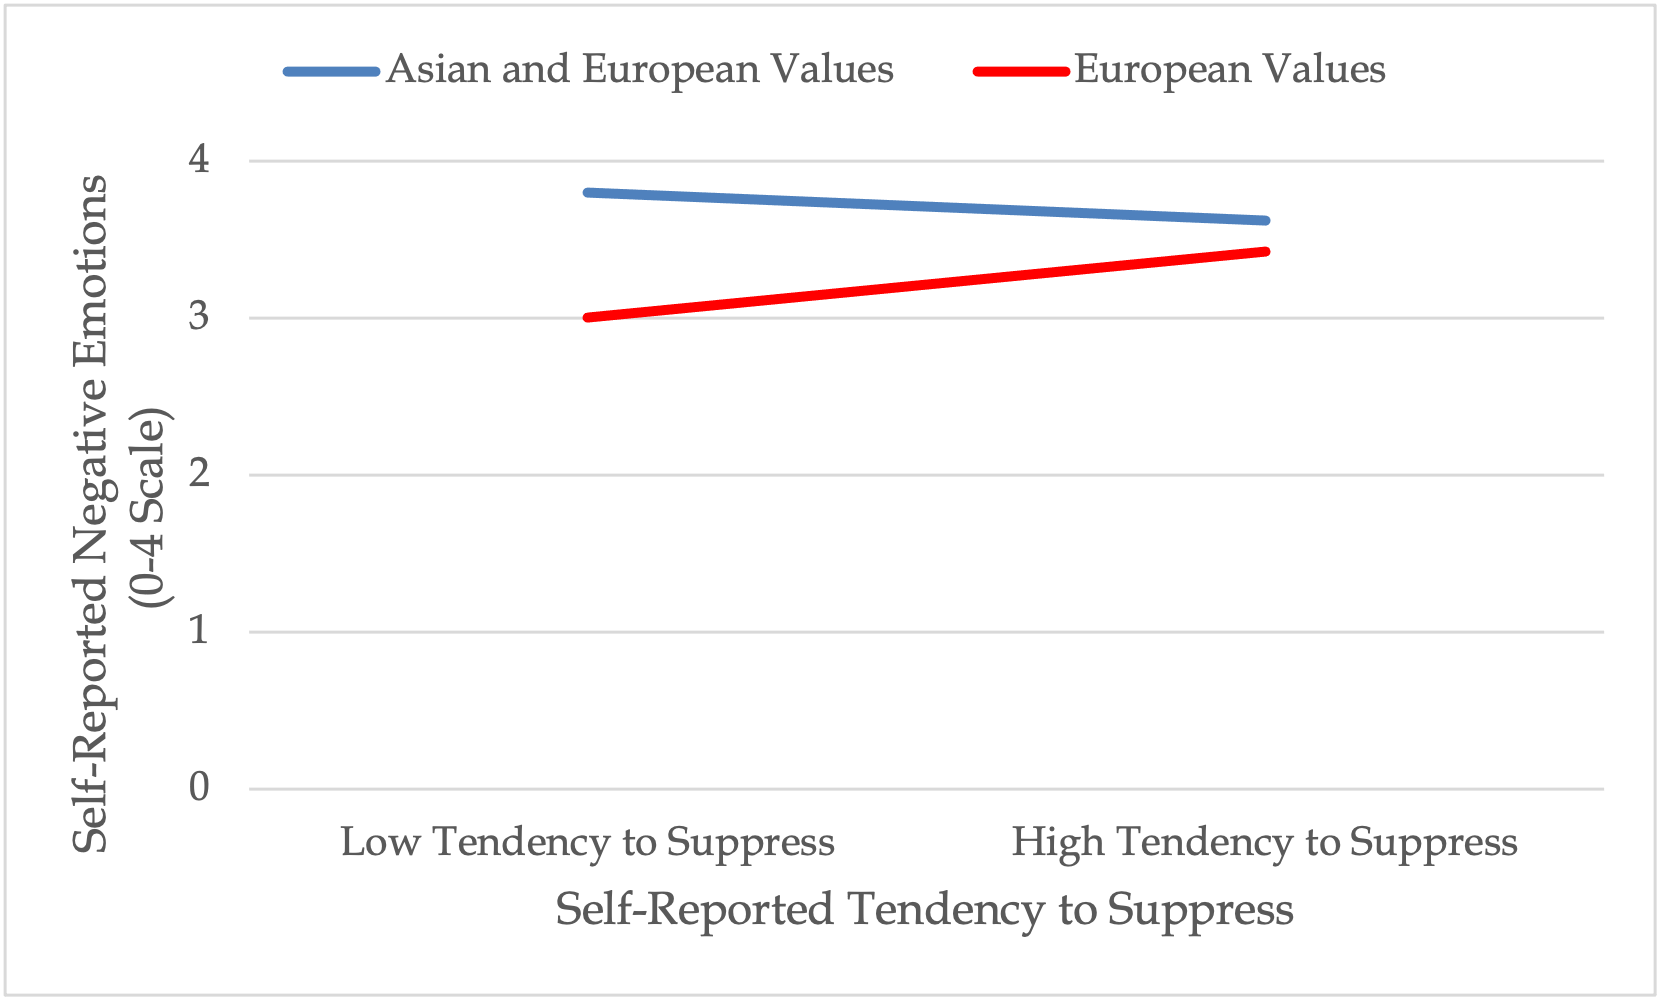
Adapted from “Emotion Regulation and Culture: Are the Social Consequences Oof Emotion Suppression Culture-Specific?” by E.A. Butler, T.L. Lee, T. L., and J.J. Gross, 2007, Emotion, 7(1), p. 36 (https://doi.org/10.1037/1528-3542.7.1.30) Copyright 2007 by the American Psychological Association.
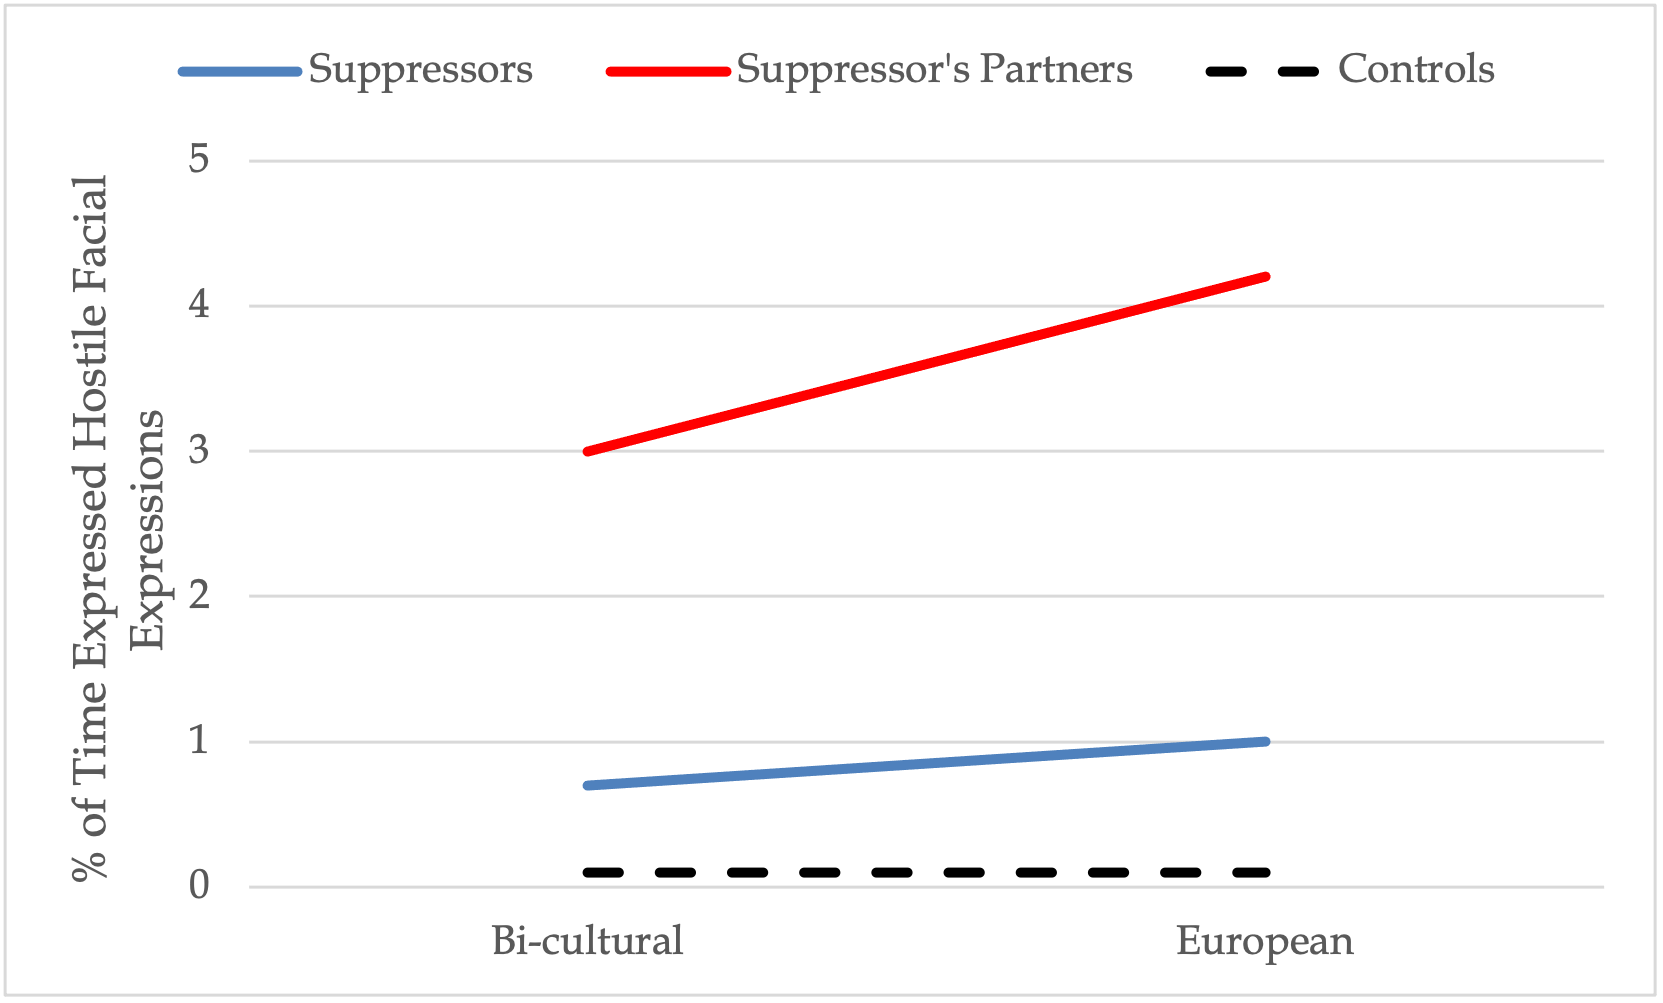
A follow-up study assigned the same women with European and bi-cultural values to suppression or control dyads as in prior studies. Both groups watched upsetting film clips and either suppressed or watched (control). Results showed that when European value participants suppressed, their partners perceived them to be more hostile and withdrawn compared to the partners of bi-cultural suppressors (see Figure 21). In addition, suppressors with European values spent more time showing hostile and unresponsive facial expressions compared to suppressors with bi-cultural values (Figures 22 and 23). What does this tell us? Well, people with European values tend to exhibit facial expressions during suppression that have a detrimental impact of their relationship interactions. This provides early support to some researchers views that suppression might be more detrimental to the health and relationships of people raised in Western countries, but not East Asian countries.
Figure 21
Interaction between Cultural Values and Regulation Group on Perceptions of Hostility and Withdrawal of Partners
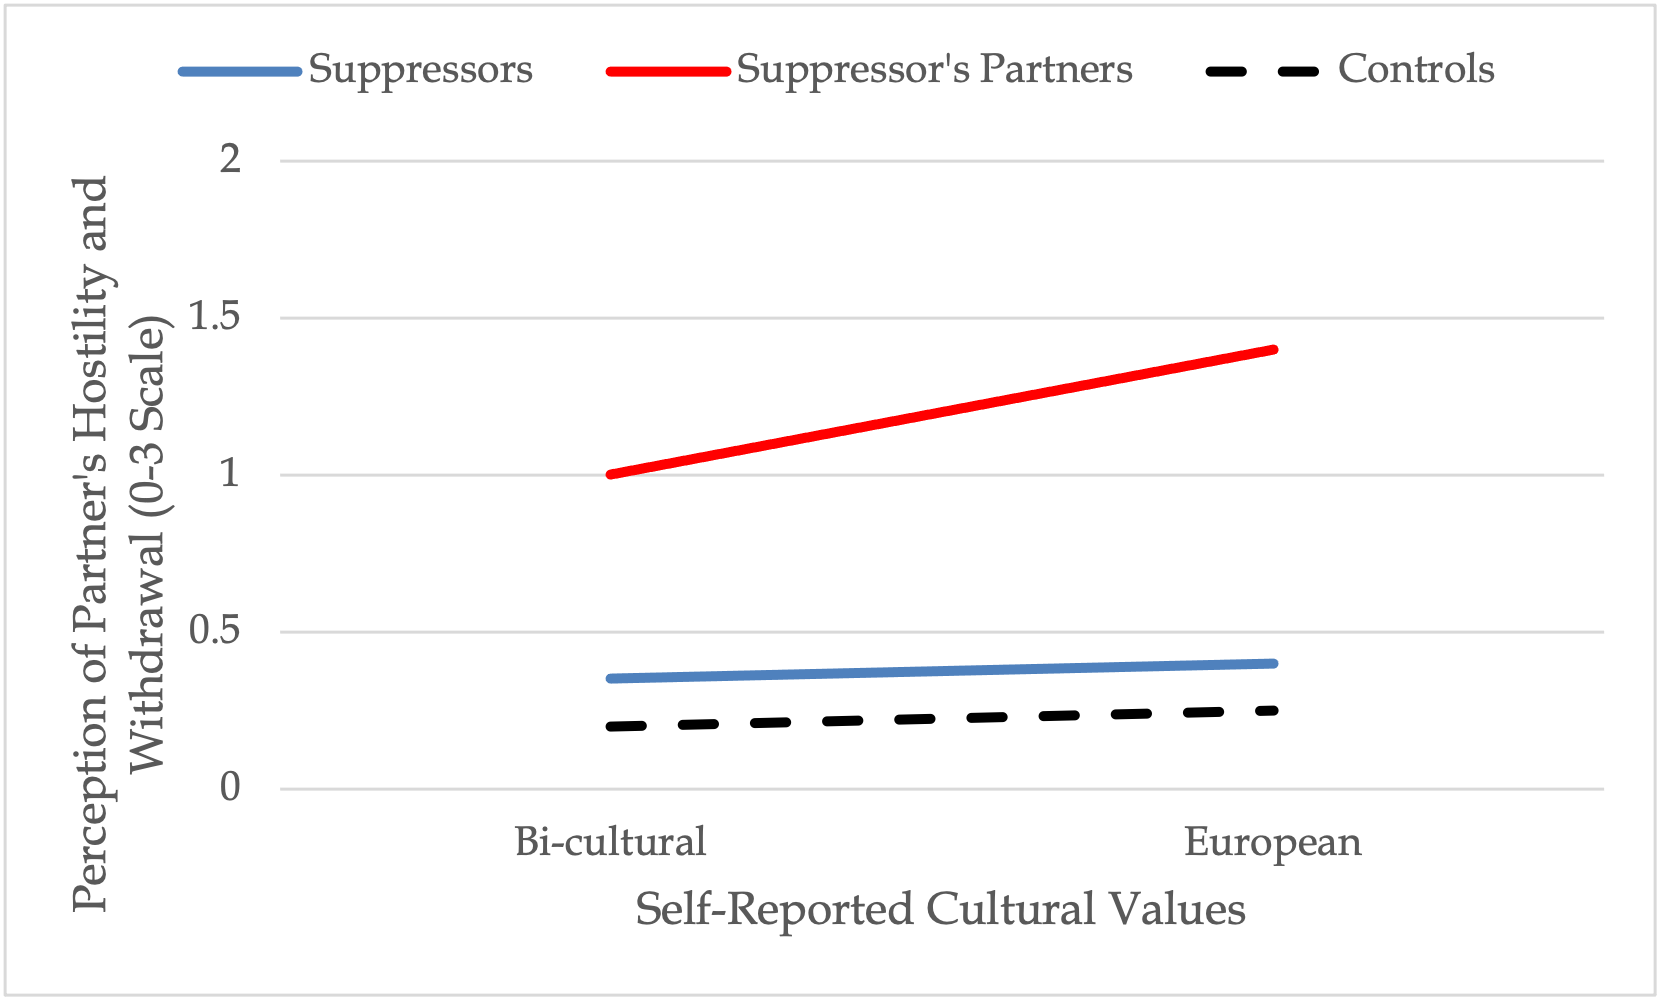
Adapted from “Emotion Regulation and Culture: Are the Social Consequences Oof Emotion Suppression Culture-Specific?” by E.A. Butler, T.L. Lee, T. L., and J.J. Gross, 2007, Emotion, 7(1), p. 42 (https://doi.org/10.1037/1528-3542.7.1.30) Copyright 2007 by the American Psychological Association.
Figure 22
Interaction between Cultural Values and Regulation Group on Percent of Time Expressing Unresponsive Facial Expressions
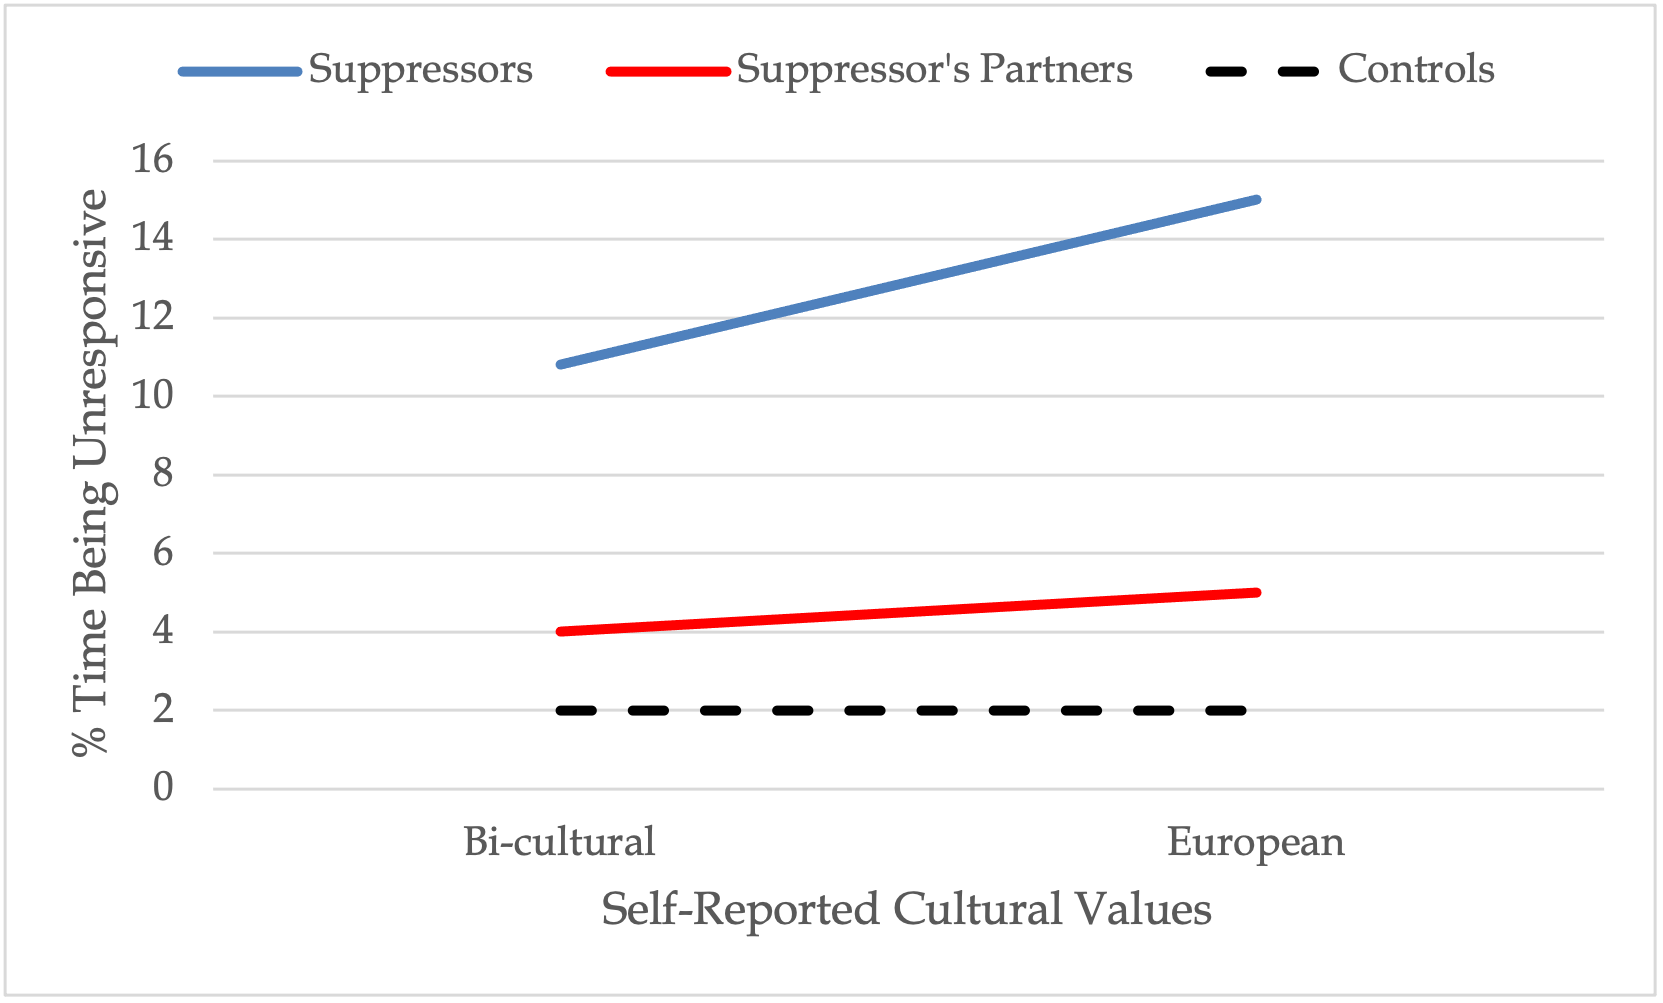
Adapted from “Emotion Regulation and Culture: Are the Social Consequences Oof Emotion Suppression Culture-Specific?” by E.A. Butler, T.L. Lee, T. L., and J.J. Gross, 2007, Emotion, 7(1), p. 43 (https://doi.org/10.1037/1528-3542.7.1.30) Copyright 2007 by the American Psychological Association.

