
Chapter 14 – Emotion Regulation
Emotion Regulation and the Brain
Recently, work has turned to assess the effect of various emotion regulation strategies on the brain. Table 5 shows the general brain areas that become more and less activated during emotion regulation. In general, strategies that require conscious processing such as reappraisal and suppression will activate brain areas linked to executive control. Structures that are often activated during an emotional experience, such as the insula and amygdala, will become deactivated.
Table 5
Changes in Brain Structure Activation During Emotion Regulation
| Emotion Regulation Activates |
|---|
| Inferior Parietal Cortex |
| Prefrontal Cortex |
| Emotion Regulation Deactivates |
|---|
| Amygdala |
| Insula |
| Orbitofrontal Cortex |
One study (Goldin et al., 2008) tested the effects of suppression and reappraisal on various brain structures. While watching 15-second neutral and negative film clips, participants were assigned to simply watch (control), suppress facial expressions, or reappraise in an objective manner, all while submitting to fMRI scans. During the negative clip, reappraisal and suppression both activated the prefrontal cortex (PFC), but at different points in time. Reappraisal activated the PFC between 0 and 4.5 seconds of starting the clip, while suppression activated the PFC between 10.5 and 15 seconds. This finding supports the process model of emotion which states that cognitive reappraisal occurs before suppression. Over time, reappraisal decreased activation in the amygdala and insula, but suppression activated the amygdala and insula. So, this finding suggests that suppression does not effectively deactivate the brain structures associated with intense emotions. Figure 24 shows how activation in the amygdala changed over time. This study might also exemplify the rebound effect found for thought suppression, such that expressive suppression might temporarily down-regulate our negative emotions, but over time we experience even more of a negative emotion.
Figure 24
Influence of Type of Emotion Regulation on Activation of Amygdala and Insula
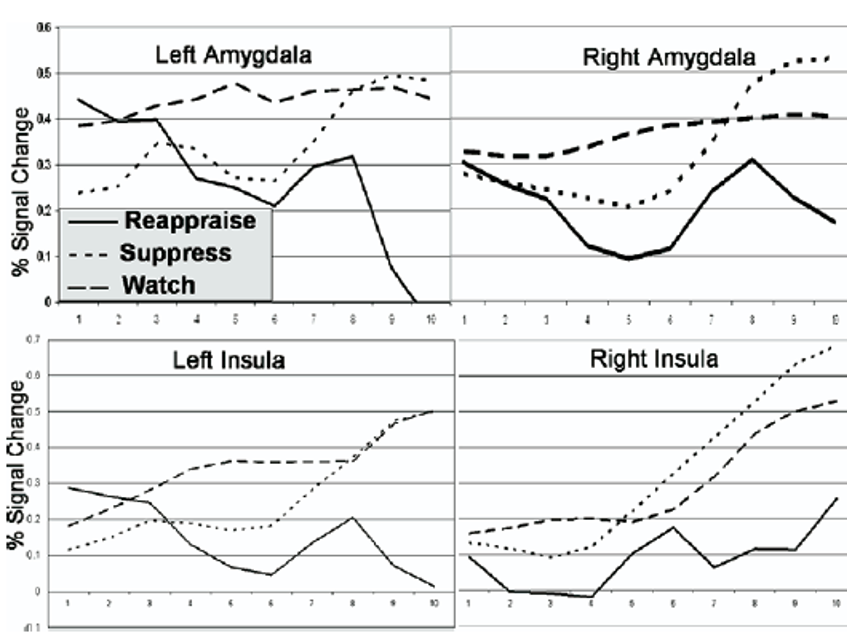 Reproduced from “The Neural Bases of Emotion Regulation: Reappraisal and Suppression of Negative Emotion,” by P.R. Goldin, K. McRae, W. Ramel, and J.J. Gross, 2008, Biological Psychiatry, 63(6), p. 580 (https://doi.org/10.1016/j.biopsych.2007.05.031) Copyright 2008 by the Society of Biological Psychiatry.
From 14:38 to 21:35, Dr. Ochsner discusses maladaptive emotion regulation and disorders, focusing on his research in borderline personality disorder and substance abuse.
