Chapter 8: Fear, Anxiety, and Stress
Seyle’s (1974) General Adaptation Syndrome (GAS)
Seyle (1974) emphasized how the physical body reacted to stress. Specifically, Seyle states that during a stressful experience, our bodies move through three stages: 1) Alarm, 2) Resistance, and 3) Exhaustion. Alarm occurs when we experience a brief period of SNS activation. During the alarm stage we experience the highest levels of arousal because our body is preparing for defensive responses. During resistance we experience moderate arousal that lasts for a long period of time. During the resistance stage, the adrenal cortex secretes three hormones – cortisol, epinephrine, and norepinephrine. These hormones prepare our body to heal wounds, fight infections, and to essentially protect our bodies from harm/death. Exhaustion occurs when the prolonged response from the resistance stage weakens our body, resulting in fatigue, loss of appetite, and exhaustion! During the exhaustion stage, we have fewer physical resources
One study (Wallbott & Scherer, 1991) investigated the facial expressions participants showed when exposed to stimuli that elicited stress. Note that this study does view stress as a basic emotion. In this study, participants completed cognitive and emotional tasks to elicit stress. In the cognitive tasks, participants had to complete difficult problems. In the emotional tasks, participants were shown slides of skin diseases and severe injuries and had to answer questions about whether the individuals would improve. In between the experimental slides, participants also completed low stress conditions to provide a control condition in which participants returned to baseline. While viewing each slides, participants physiology was measured and their fascial expressions were recorded. Facial expressions were coded with FACS (Ekman & Friesen, 1978).
Below, the findings are discussed. To view real-life movements of each action unit, please visit this webpage: FACS – A Visual Guidebook.
- Action Unit 4 – Brow Lowerer/Corrugator: Compared to low stress conditions, participants in both stress conditions showed more brow lowering. Typically brow lowerer occurs with anger, sadness, fear, and disgust. and may indicate the individual is highly focused on something in their environment.
- Action Unit 12 – Lip Corner Puller/Zygomatic: In the cognitive stress condition, participants showed more zygomatic change compared to the control and emotions stress conditions. Participants in the emotional stress condition, participants showed less zygomatic change compared to the other conditions. So, when experiencing cognitive stress participants smiled more, but when experiencing emotional stress participants smiled less. Typically, AU 12 changes during joy and contempt experiences – both which map onto feeling positive. Note that the authors suggested AU 12 also changes when people are suppressing their emotional facial expressions.
- AU 25 Parting of Lips: During the cognitive and emotional stress conditions, participants showed more parting of lips compared to control conditions. Comparing the two stress conditions, participants showed more parting of lips during cognitive conditions than emotional conditions. Although the authors indicated AU 25 changes with increased attention, more recent work suggest AU 25 changes with several negative emotions including anger, disgust, and fear (CITATION).
- AU 26: Jaw Drop: Participants showed significantly more jaw dropping during the cognitive stress condition, while in the emotional stress condition participants showed few jaw drops. Similar to AU 25, the authors suggest AU 26 changes during concentration. But other work suggests that jaw drop occurs during fear or surprise (CITATION).
- Physiological Measures: Participants showed increased skin conductance during the stress conditions compared to the baseline conditions, indicating they experienced more SNS arousal during the stress conditions. During these conditions, participants also showed increased pulse and respiration rate (compared to baseline), and these measures were higher in the cognitive stress condition than in the emotional stress condition.
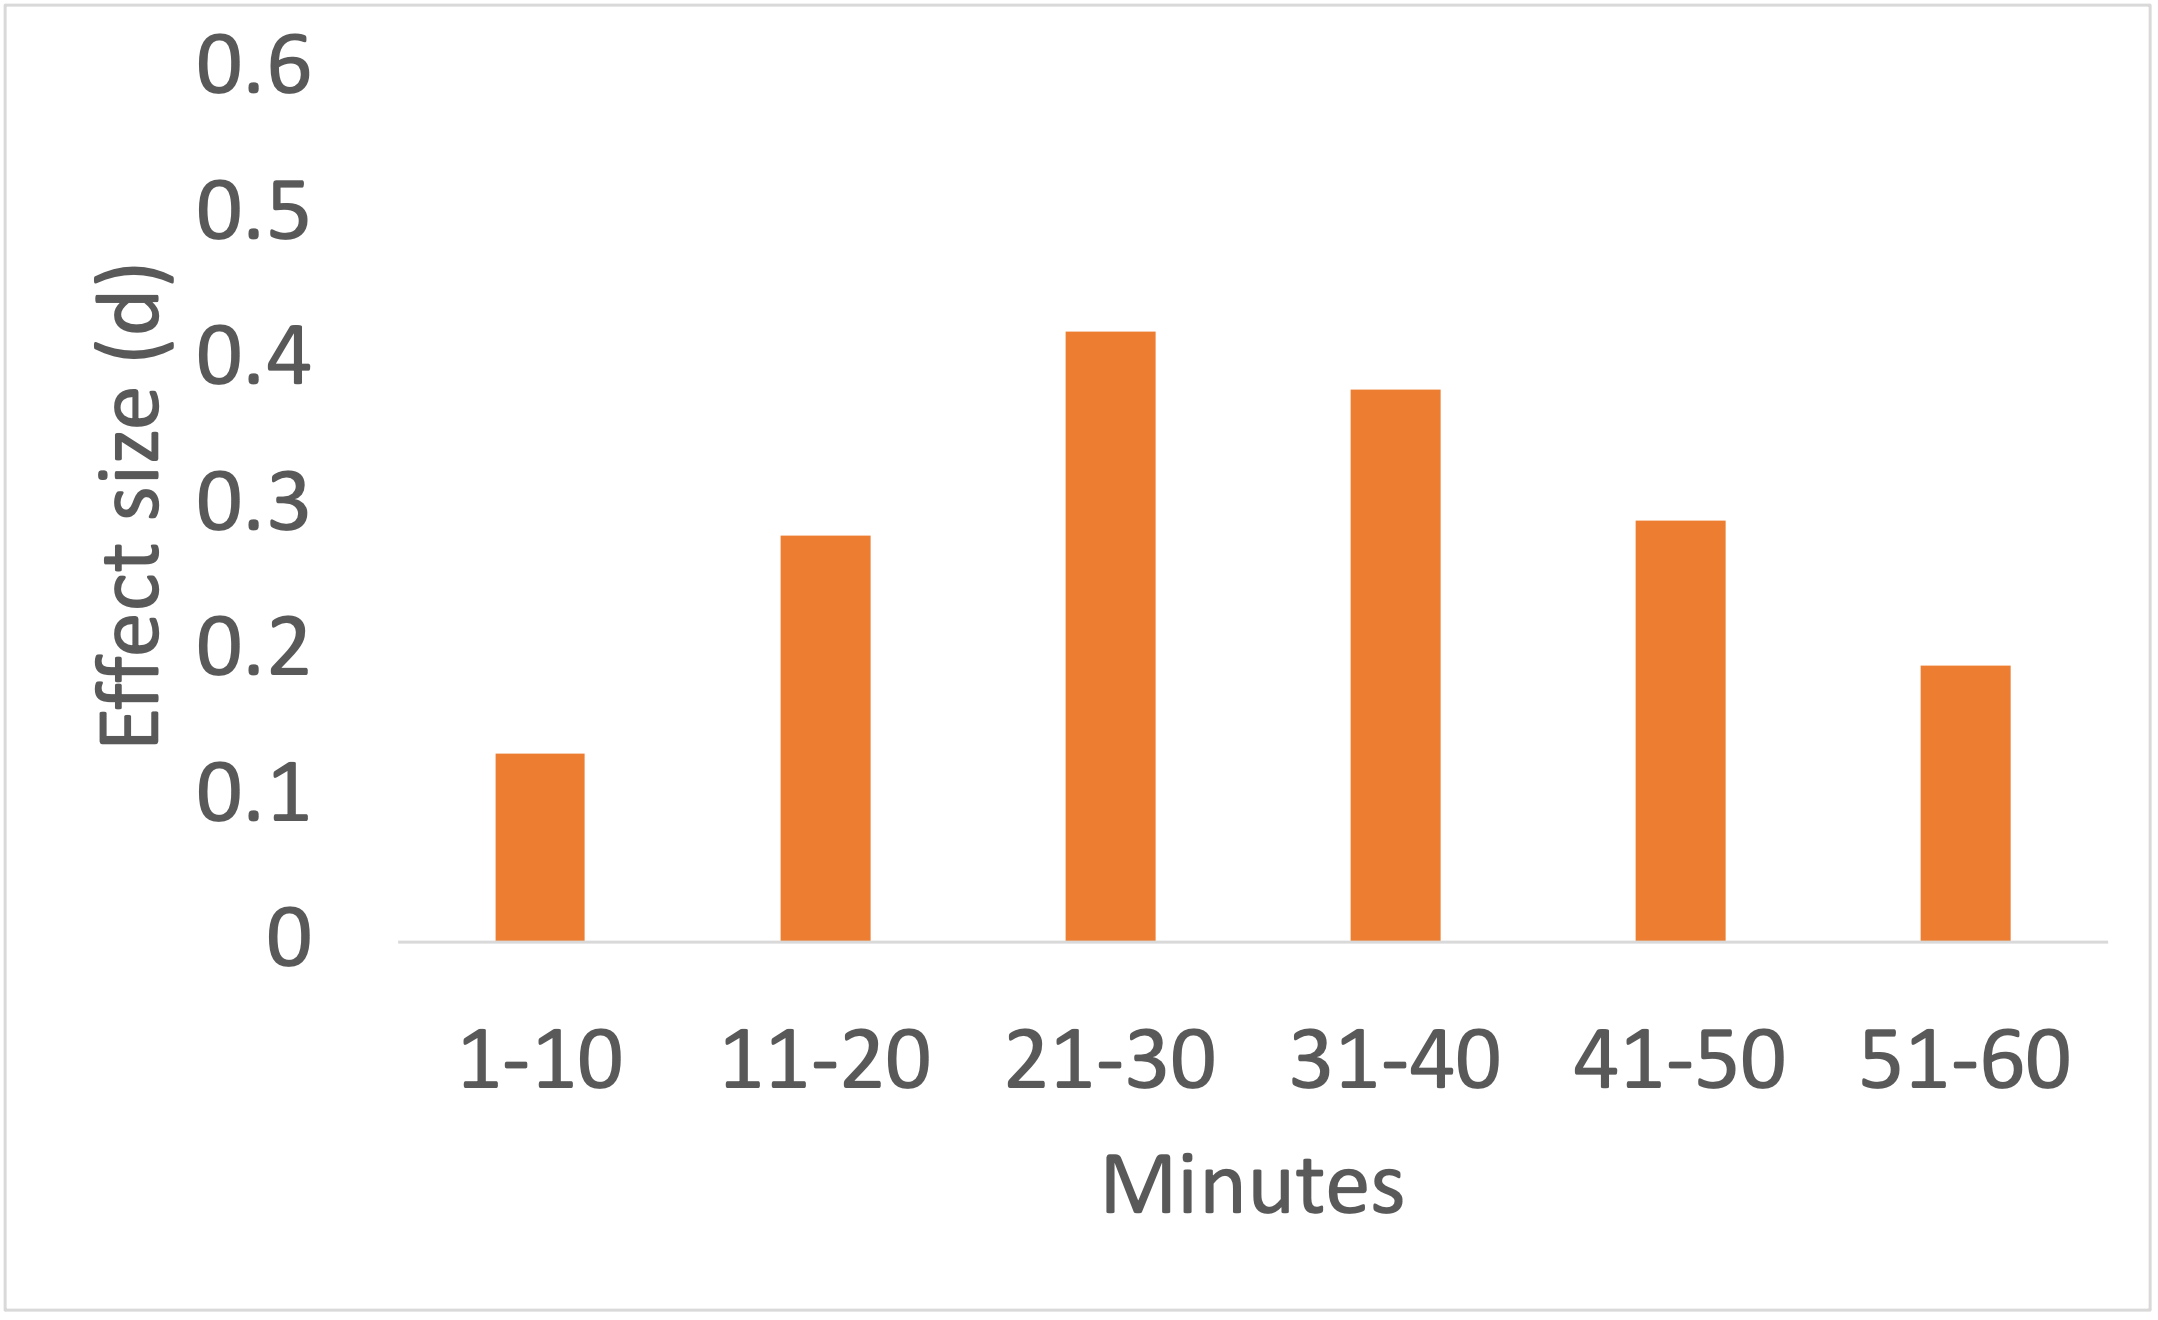
Figure 20
Cortisol Changes after Onset of Stressor

Adapted from “Acute stressors and cortisol responses: a theoretical integration and synthesis of laboratory research,” by S.S. Dickerson and M.E. Kemeny, 2004, Psychological Bulletin, 130(3), p. 369 (Acute Stressors and Cortisol Responses: A Theoretical Integration and Synthesis of Laboratory Research.). Copyright 2004 by the American Psychological Association.
Figure 21
Cortisol Recovery
Adapted from “Acute stressors and cortisol responses: a theoretical integration and synthesis of laboratory research,” by S.S. Dickerson and M.E. Kemeny, 2004, Psychological Bulletin, 130(3), p. 373 (Acute Stressors and Cortisol Responses: A Theoretical Integration and Synthesis of Laboratory Research.). Copyright 2004 by the American Psychological Association.
The figure above shows that cortisol levels remained elevated through the 40 minutes after the stressful task had ended. Again, these findings show that stress is NOT an emotion because emotions quickly dissipate after the eliciting event ends. In these figures, we can identify Seyle’s three stages. The alarm stage occurred during the 21-40 minutes after the stressor began in Figure 20. I say 21-40 minutes because the time periods 21-30 and 31-40 minutes did not significantly differ in the amount of cortisol. The resistance stage may have started 41-50 minutes after the stressor occurred, in Figure 20. This is the first time period during which cortisol levels significantly drop from earlier time periods. The exhaustion stage occurred 41-60 minutes poststressor in Figure 21 because at this point cortisol has returned to baseline levels.
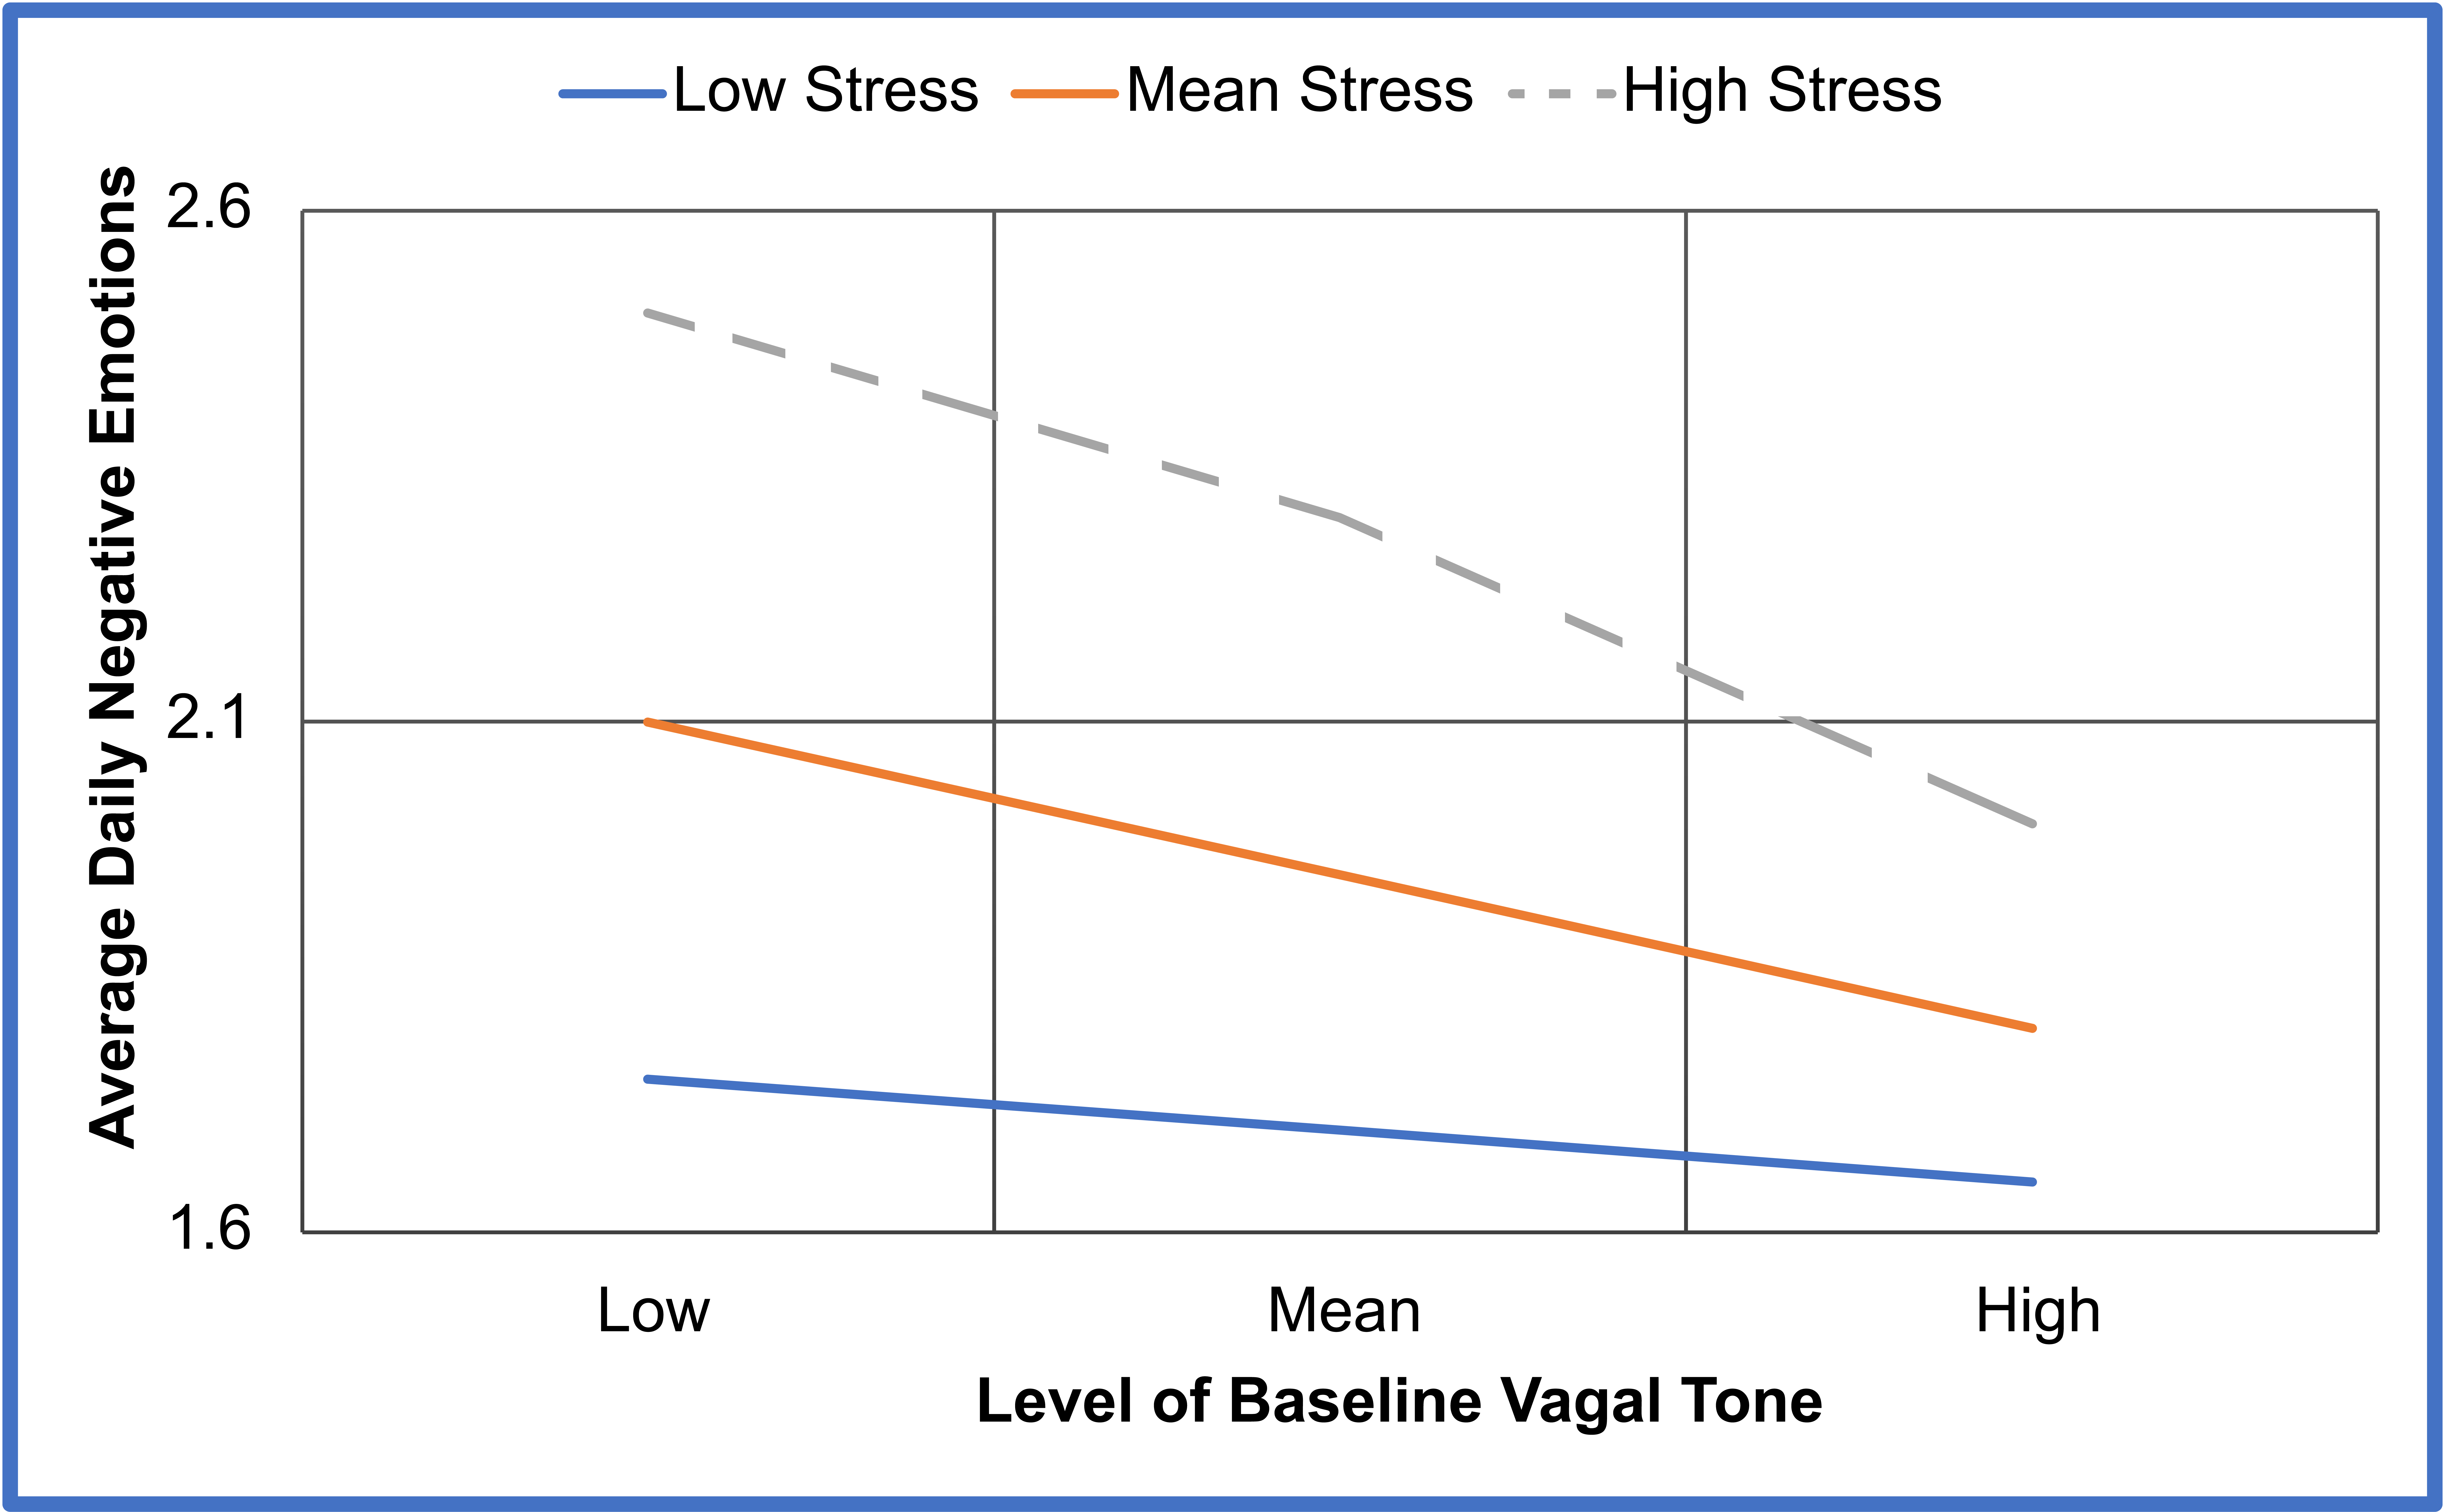
Another study (Fabes & Eisenberg, 1997) investigated how baseline vagal tone influence people’s stress during a stressful task. We discussed vagal tone here. Vagal tone is an indicator of PNS activation and is associated with the experience of low arousal, positive emotions and better emotion regulation. In this study, participants viewed a neutral film of dolphins swimming with calm music in the background. During the neutral film, researchers obtained a baseline measure of vagal tone. Based on these findings, participants were divided into low, mean, or high vagal tone groups. Participants then completed a 2-week diary. Each day, they described their most stressful experience that day, rated the level of stress, rated 14 emotions about this event, and rated their coping responses. Figure 22 shows the findings. The baseline level of vagal tone from part 1 of the study is on the x-axis. The y-axis shows the outcome variable, which is the average of the extent to which participants experienced 14 negative emotions across the 2-week period. Each line represents participants’ stress ratings for each event averaged across the two-week period. For moderate and high stressors, high vagal tone was associated with fewer negative emotions compared to low and mean vagal tone groups. For events low in stress, differences were not found between the three vagal tone groups. These findings suggest that the amount of stress we experience during a stressful event does depend on our baseline vagal tone. People with high vagal tone, experienced fewer negative emotions.
Figure 22
Impact of Vagal Tone and Severity of Stress on Self-reported Negative Emotions


