
Chapter 13: Positive Emotions
Love and Brain Activation
Bartels and Zeki (2000, 2004) conducted two studies on love – romantic love (2000) and maternal love (2004). In the romantic love study (2000), while in an fMRI machine, participants viewed a photo of their romantic partner and of 3 friends who were the same sex, age, and relationship length as their romantic partner. In the maternal love study (2004), participants viewed photos of their own child, other children, and friends. In both studies, the following three brain areas showed more activation when participants viewed the romantic partner or their own child (vs. the friend/child condition): ventral striatum (putamen, globus pallidus, caudate nucleus; all part of the reward circuit), anterior cingulate cortex, and insula. Many of these structures contain receptors for the bonding/attachment hormones oxytocin and vasopressin. Some differences were found. Romantic love, but not maternal love, activated the hippocampus and hypothalamus, while maternal love only activated the periaqueductal gray (PAG) and orbito-frontal cortex. (Note: gender differences in maternal/romantic love were not found). Now, look back at the findings for the hate circuit and compare the activated structures. What do you notice? Bartels and Zeki (2000) report that their study provides evidence of a unique love circuit comprised of the reward circuit, cingulate cortex, and insula. Maybe future research will determine that early-stage passionate love and late-stage companionate love are two separate emotions accompanied by different biological changes. Interestingly, the amount of activation in the reward circuit varies according to the amount of time participants were in love (Aron et al., 2005). Participants who reported more passionate love on a self-report scale showed more activation in the caudate nucleus when viewing a photo of their romantic partner (See Figure 19). In addition, activation in the VTA (a dopamine-rich center) was positively correlated with attractiveness ratings of the romantic partner. Brain activation changed as relationship length increased, suggesting that as our feelings of love change, our brain activation changes.
Figure 19
Relationship between Activation in Caudate Nucleus and Self-Reported Passionate Love (Aron et al., 2005)
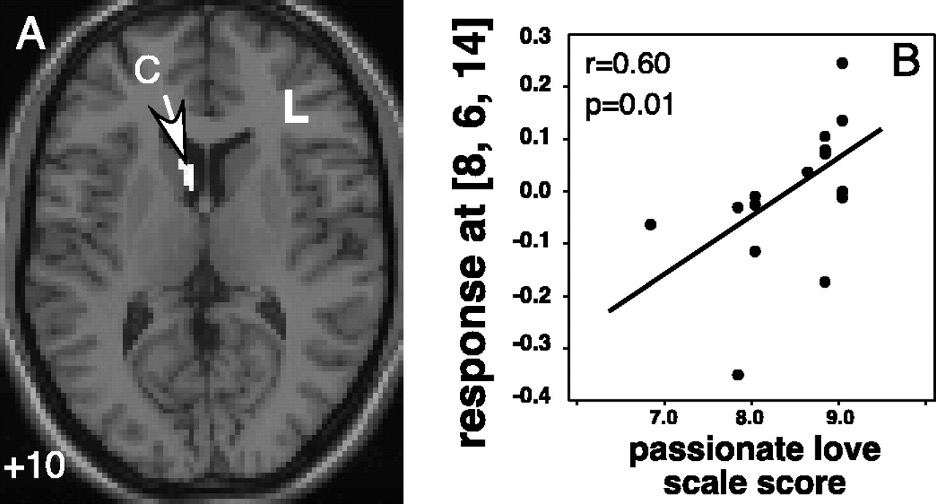
The graph on the right has an x axis labeled “passionate love scale score”, has the values “7.0”, “8.0”, and “9.0” labeled. The y axis labeled “response at [8, 6, 14]”, which starts at -0.4 and increases in increments of 0.10. There is also a key on this graph that reads: “R=0.60”, and “P=0.01”. The graph is also labeled “B” indicating its accompaniment to the neuroimage labeled “A”.
Reproduced from “Reward, motivation, and emotion systems associated with early-stage intense romantic love,” by A. Aron, H. Fisher, D.J. Mashek, G. Strong, H. Li, and L.L. Brown, 2005, Journal of Neurophysiology, 94(1), p. 332 (https://doi.org/10.1152/jn.00838.2004) Copyright 2005 by The American Physiological Society.
