
Chapter 7: Physiological Measures of Emotion
Other Central Nervous System Measures
Electroencephalography (EEG) is a central nervous system measure. In an EEG, an electrode headcap is placed on the scalp (see Figure 4). Then, over time, the headcap measures changes in the electricity from action potentials of neuron groups. The EEG cannot determine in which brain structure the neuronal activity is occurring. The EEG can determine whether the right or left of the brain is more active or whether the back or front of the brain is more active. Frontal asymmetry (also called hemispheric lateralization) can be determined by EEG (see Figure 5). Frontal asymmetry occurs when a person experiences greater activation of the right or left frontal lobe. Typically, more activation of the right lobe is associated with avoidance behavior (e.g., fear) whereas more activation of the left frontal lobe is associated with approach emotions (e.g., joy, anger). Later in this chapter, we will return to hemispheric lateralization when we discuss three theories that explain the relationship between the left and right side of the brain and emotional experiences.
Figure 4
EEG Headcap
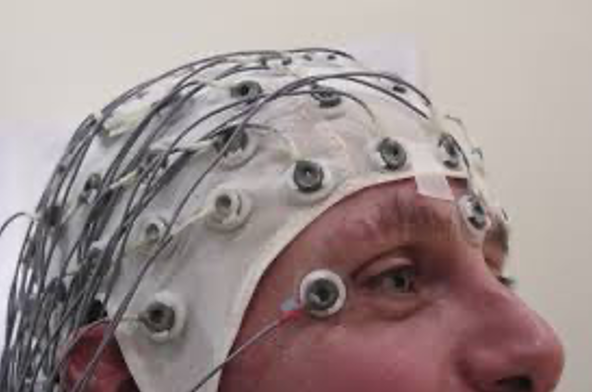
Reproduced from “A cap holds electrodes in place while recording an EEG” by C. Hope, 2012. Open Access. Creative Commons Attribution 2.0 Generic. Retrieved from:
“Volunteer Duty” Psychology Testing | Photo by Chris Hope AS… | Flickr
Figure 5
Visual display of hemispheric lateralization
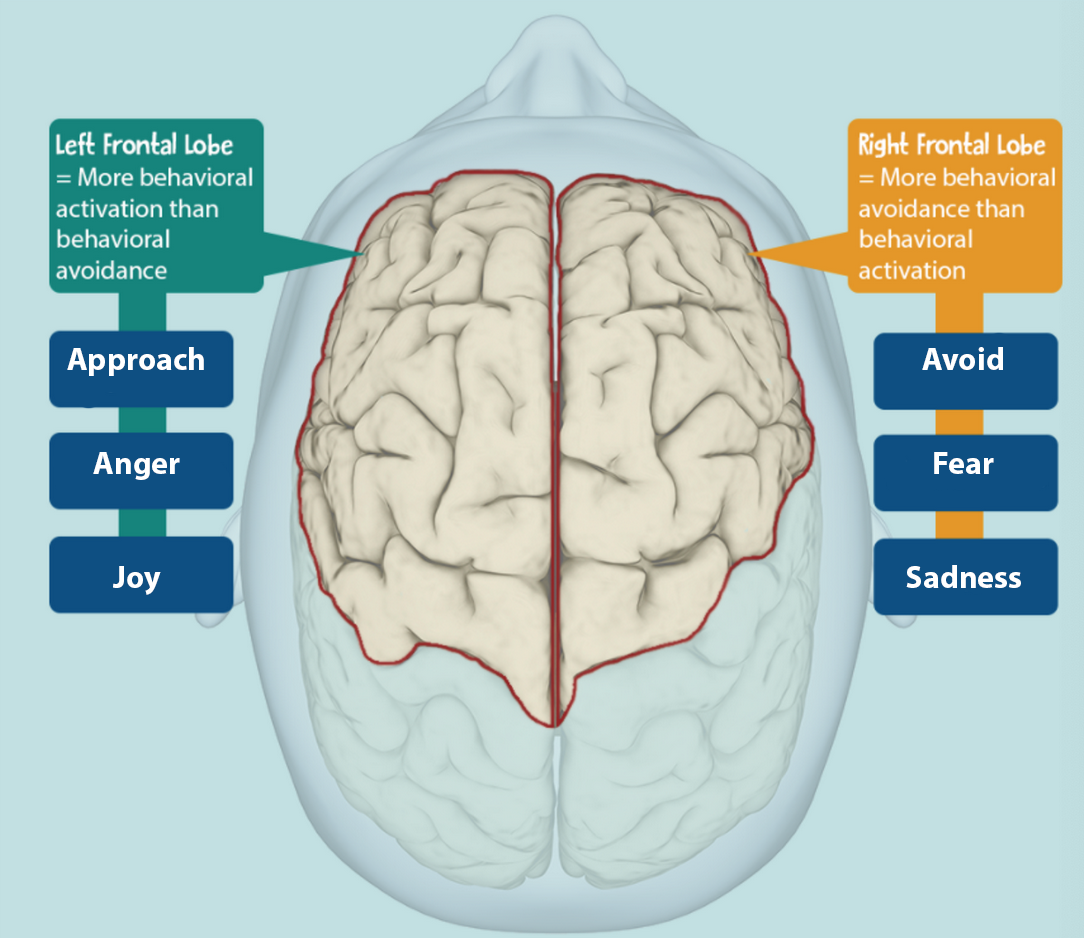
Adapted with permission from Penn State World Campus PSYCH 238: Personality Psychology. Copyright 2021 by Penn State World Campus.
fMRI and PET scans provide better measures of specific structures involved in specific emotions. The fMRI measures the uptake of oxygen in the blood. To conduct a PET scan (see Figure 6), the participant is injected with a radioactive isotope, and then the metabolic activity of a brain structure is measured. Greater signals from the fMRI and the PET scan provide evidence that more blood is flowing to a certain brain structure and thus the brain structure is activated and working.
Figure 6
Example of PET scan machine
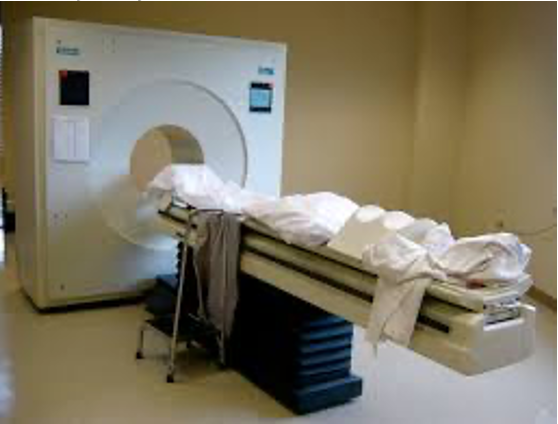
Reproduced from “This is a PET scanner” by L. West, 2006. Open Access. Creative Commons Attribution 2.0 Generic. Retrieved from: PET scan | We all deal with trouble in different ways. I dec… | Flickr
