
Chapter 8: Fear, Anxiety, and Stress
S.M. Case Study: Conceptual Understanding of the Components of Fear
Does S.M. know the events that cause fear and how our emotion components change during fear? When asked, she correctly identifies the eliciting events that elicit fear such as being threatened and being alone in a dark alley at night (Adolphs, 1995). And she states that when people experience fear their heart pounds and they scream and run away, suggesting she understands the behavior and physiological changes caused by fear. Finally, when asked to sort emotion words based on similarity, she placed afraid, scared, worried, terrified, and alarmed into the same group (Adolphs, 1995). So, it appears that S.M. understands and remembers the characteristics of a fear experience, yet her body and brain do not respond in such a way to identify fear in facial expressions or to avoid dangerous situations. S.M. has been mugged in the same parking lot two times – suggesting that even though she can explicitly identify the eliciting events, she has not learned to avoid dangerous situations. Patients with amygdala damage report feeling fear normally, suggesting that their subjective feelings should not differ from control participants. But how do we know their fear is the same as our fear?
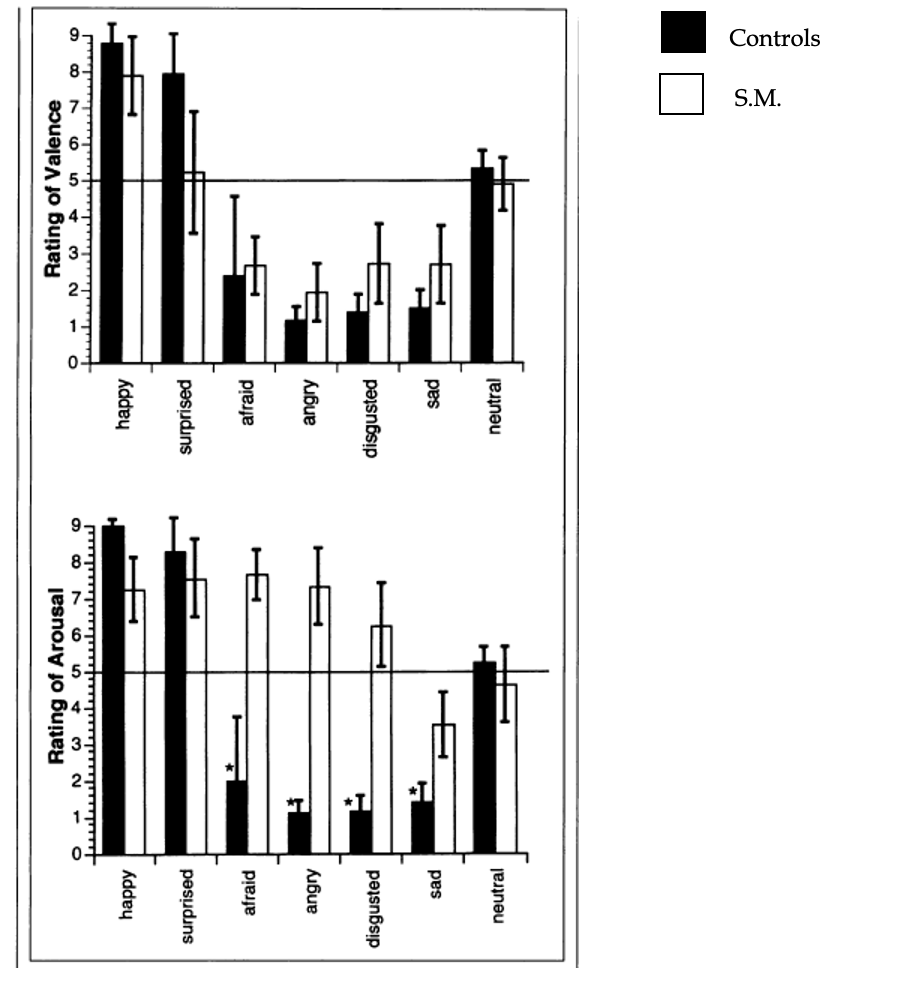
S.M. and control participants rated seven facial expressions (happiness, surprise, fear, anger, disgust, sadness, and neutral), along Russell’s (1980) arousal and valence dimensions (Adolphs, Russell, et al., 1999). Compared to the normal controls, S.M. reported the same valence, but different arousal ratings for the facial expressions (see Figure 14). In particular, S.M. rated facial expressions of fear, anger, disgust, and sadness as significantly lower in arousal than control subjects. Similar findings showing deficits in arousal, but not valence, were obtained when S.M. and control participants rated emotion stories and words (Figure 15). As we discussed in an earlier section on IAPS photos, highly unpleasant photos are typically rated as arousing, but S.M. did not demonstrate this correlation.
Figure 14
Valence and Arousal Ratings of Emotional Facial Expressions
Long Description
The image contains two vertical bar graphs, one above the other, comparing how control participants and an individual referred to as S.M. rated different emotions on two dimensions: valence and arousal.
Top Graph: Rating of Valence
- Y-axis: Scale from 0 (very negative) to 9 (very positive).
- X-axis: Emotions listed:
- Happy
- Surprised
- Afraid
- Angry
- Disgusted
- Sad
- Neutral
- Bars:
- Black bars represent control participants.
- White bars represent S.M..
- Observations:
- Controls rated Happy highest (~8.5), followed by Surprised (~7.5).
- S.M. rated Happy slightly lower (~8), and Surprised around 6.
- For negative emotions like Afraid, Angry, and Disgusted, S.M.’s ratings were generally lower than controls.
- Neutral was rated more positively by controls (>5) than by S.M. (~4).
Bottom Graph: Rating of Arousal
- Y-axis: Scale from 0 (low arousal) to 9 (high arousal).
- X-axis: Same seven emotions as above.
- Bars:
- Black bars for controls.
- White bars for S.M.
- Observations:
- Controls rated Happy and Surprised as highly arousing (>8 and ~7).
- S.M. rated these slightly lower (~7 and ~6).
- For Afraid, Angry, and Disgusted, S.M.’s arousal ratings were significantly lower than controls (often <1).
- Neutral was rated similarly by both groups (~4–5).
Reproduced from “A role for the human amygdala in recognizing emotional arousal from unpleasant stimuli,” by R. Adolphs, J.A., Russell, and D. Tranel, 1999, Psychological Science, 10(2), p. 169, (A Role for the Human Amygdala in Recognizing Emotional Arousal From Unpleasant Stimuli). Copyright 199 by the American Psychological Society
Figure 15
Valence and Arousal Ratings of Emotion Sentences and Words
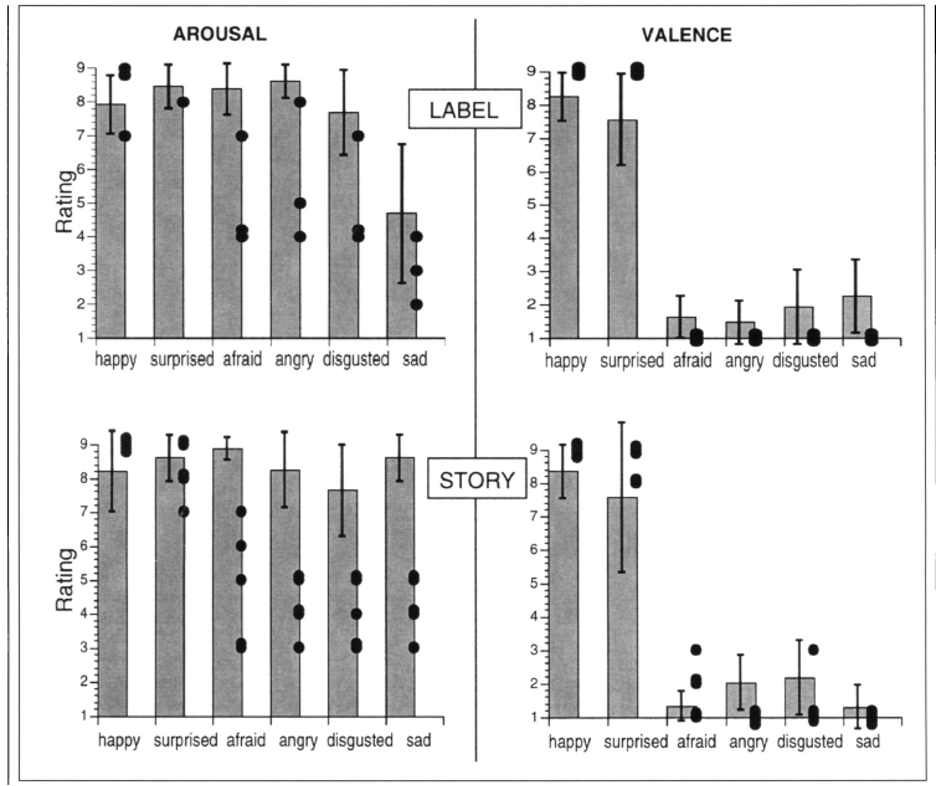
Note. The dot represents S.M.’s ratings over three trials. The bars represent the average scores of the control participants. Reproduced from “A role for the human amygdala in recognizing emotional arousal from unpleasant stimuli,” by R. Adolphs, J.A., Russell, and D. Tranel, 1999, Psychological Science, 10(2), p. 170, (A Role for the Human Amygdala in Recognizing Emotional Arousal From Unpleasant Stimuli). Copyright 1999 by the American Psychological Society
Long Description
The image contains four vertical bar graphs arranged in a grid, comparing arousal and valence ratings for six emotions under two different conditions: LABEL and STORY.
Graph Layout:
- Top Row: Ratings of Valence
- Left: LABEL condition
- Right: STORY condition
- Bottom Row: Ratings of Arousal
- Left: LABEL condition
- Right: STORY condition
Axes:
- X-axis (all graphs): Lists six emotions:
- Happy
- Surprised
- Afraid
- Angry
- Disgusted
- Sad
- Y-axis: Rating scale from 1 to 9
Graph Features:
- Each emotion is represented by a bar showing the mean rating.
- Error bars extend from the top of each bar, indicating variability or confidence intervals.
- Black dots represent individual participant data points, scattered around each bar for visual clarity.
Conditions:
- LABEL: Participants rated emotions based on labeled facial expressions.
- STORY: Participants rated emotions based on contextual stories or scenarios.
Figure 16
Self-reported Subjective Feelings for Control Participants and S.P.
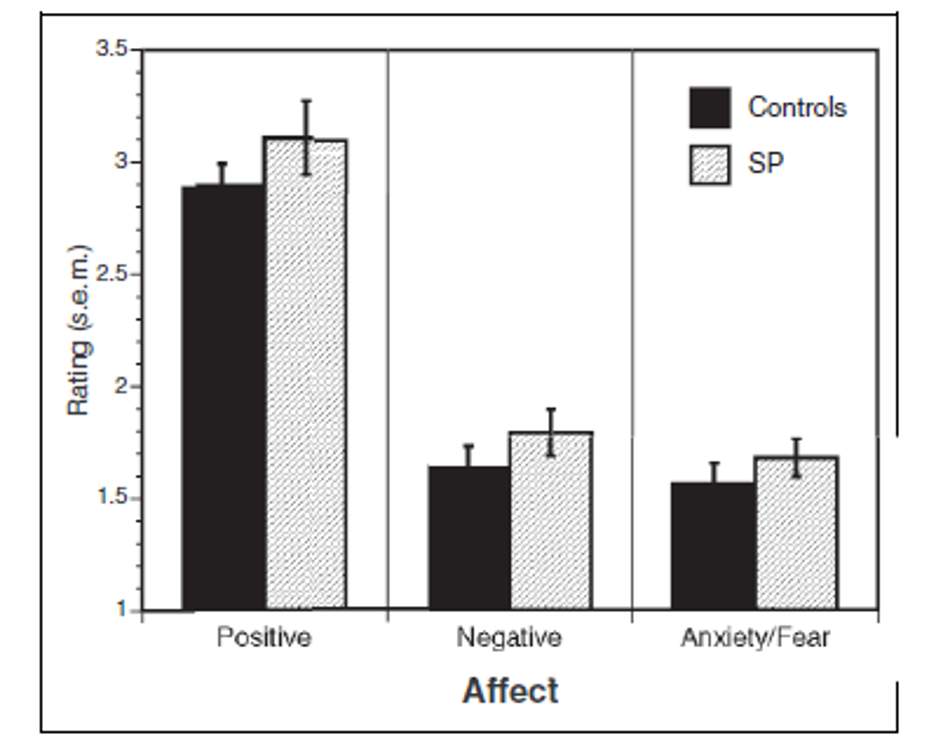
Note. S.P. has bilateral amygdala damage. Reproduced from “Is the human amygdala critical for the subjective experience of emotion? Evidence of intact dispositional affect in patients with amygdala lesions,” by A.K. Anderson and E.A. Phelps, 2002, Journal of Cognitive Neuroscience, 14(5), p. 713, (Is the Human Amygdala Critical for the Subjective Experience of Emotion? Evidence of Intact Dispositional Affect in Patients with Amygdala Lesions ). Copyright 2002 Massachusetts Institute of Technology.
Long Description
This image is a bar graph that compares how two groups—Controls and SP—rated three types of affect:
- Positive
- Negative
- Anxiety/Fear
Axes:
- X-axis: Lists the three affect categories.
- Y-axis: Represents the mean rating with standard error of the mean (s.e.m.), ranging from 1 to 3.5.
Bars:
- Black bars represent the Control group.
- Gray bars represent the SP group.
- Each bar includes an error bar to show variability in the ratings.
Observations:
- For Positive affect, the Control group shows a higher rating than SP.
- For Negative affect, SP shows a slightly higher rating than Controls.
- For Anxiety/Fear, SP shows a noticeably higher rating than Controls.
This graph illustrates how affective responses differ between the two groups, particularly in the domain of anxiety and fear.
