
Chapter 8: Fear, Anxiety, and Stress
S.M. Case Study: Impairment in Recognition
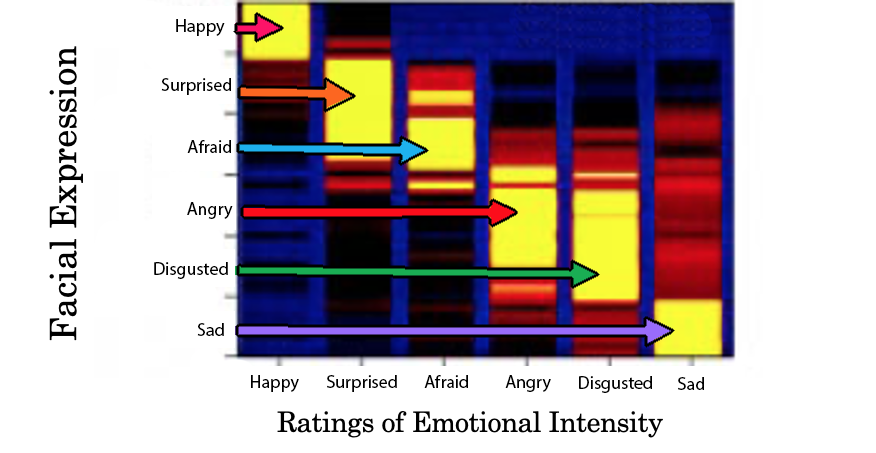
In the first set of tasks, participants were presented with photos of human emotional facial expressions (similar to Ekman’s judgment methodology; Adolphs, Tranel, et al., 1999). Specifically, participants were shown six male and female faces of anger, fear, happiness, surprise, sadness, disgust, and also three neutral faces. While viewing each photo, participants indicated on a scale of 0 to 5 (0 = not at all; 5 = very much) the intensity of six emotions shown on the face: happy, sadness, disgusted, angry, afraid, and surprised. During each trial, participants were asked to rate the intensity of one of the six emotion labels for a group of facial expressions. Figure 11 below displays the findings for three groups of participants. The bilateral amygdala damage group included 9 participants, one of whom was S.M. As indicated in the legend, yellow colors indicate participants selected high intensity (around a 4/5) for the emotion in the face, red indicates moderate intensity (around a 3) and blue indicates low intensity (around a 1/2). To interpret each figure, you should compare the facial expression displayed to participants in the y-axis to the emotional intensity rating (1-5 scale) as reported by the participants. Some findings are described under the figure.
Figure 11
Long Description
This image is a horizontal heatmap chart that shows how people rated the emotional intensity of six different facial expressions. The chart is designed to help viewers understand how strongly each expression is typically perceived.
- Facial Expressions: Listed vertically on the left side of the chart are six expressions:
- Happy
- Surprised
- Afraid
- Angry
- Disgusted
- Sad
- Intensity Ratings: The horizontal axis represents emotional intensity, likely on a scale from low to high. Each expression has a horizontal bar that stretches across this scale.
- Color Bands: Each bar is made up of multiple colored bands. These bands vary in width and color:
- Wider bands mean that more people gave that intensity rating for that expression.
- Narrower bands mean fewer people gave that rating.
- The color gradient likely moves from cool colors (like blue or green) for low intensity to warm colors (like orange or red) for high intensity.
- Arrows: Each expression label has an arrow pointing to its corresponding bar, helping to match the label with the correct data.
This chart helps show that some expressions, like “Afraid” or “Angry,” may have wider bands at higher intensity levels, meaning they are often seen as more intense. Others, like “Happy” or “Sad,” may have more evenly spread or lower-intensity ratings.
Long Description
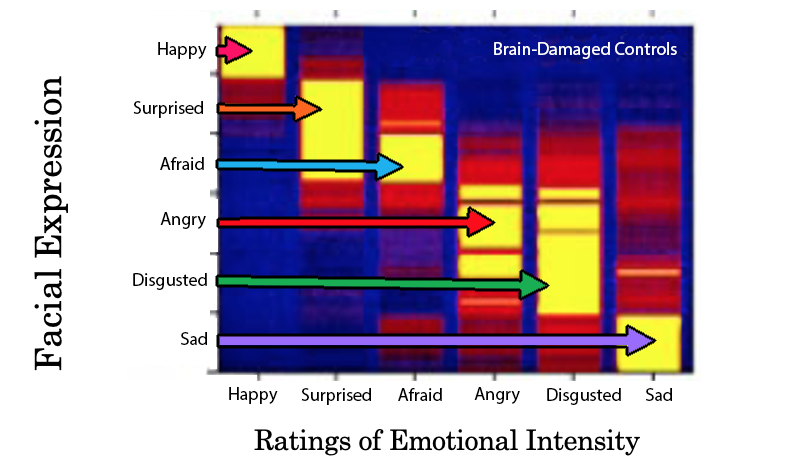
Bottom Heatmap:
- Labeled “Brain-Damaged Controls”, this heatmap uses the same layout and scale as the top one.
- It also shows emotional intensity ratings for the same six facial expressions.
Key Differences Between the First Two Heatmaps:
- Distribution of Ratings: The bottom heatmap shows different patterns in the width and placement of color bands compared to the top. This suggests that brain-damaged control participants rated some expressions with different intensity levels than the general group.
- Band Widths: For certain expressions, such as “Afraid” or “Disgusted,” the bands in the bottom heatmap may be narrower or shifted, indicating less consensus or different perceptions of intensity.
- Color Intensity: The overall color saturation may differ, reflecting changes in how strongly emotions were perceived.
This comparison helps illustrate how brain damage may affect the perception or interpretation of emotional facial expressions.
Long Description
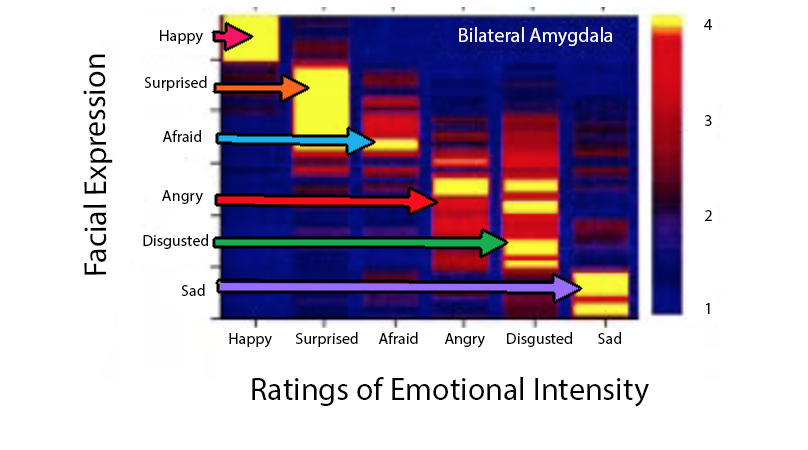
This image is a single heatmap titled “Bilateral Amygdala”, which visualizes how emotional intensity is rated for six facial expressions, likely based on neural data.
Axes:
- Y-axis (Vertical): Lists six facial expressions:
- Happy
- Surprised
- Afraid
- Angry
- Disgusted
- Sad
- X-axis (Horizontal): Labeled “Ratings of Emotional Intensity”, likely representing a scale from low to high.
Color Gradient:
- The heatmap uses a color scale from blue (low intensity) to red (high intensity) to represent the strength of emotional intensity ratings for each expression.
Colored Arrows:
- Each facial expression has a horizontal arrow pointing across the heatmap:
- Pink for Happy
- Orange for Surprised
- Light Blue for Afraid
- Red for Angry
- Green for Disgusted
- Purple for Sad
These arrows help visually track the direction and strength of each expression’s perceived intensity.
Differences from the Previous Two Heatmaps:
- Data Source: This heatmap is labeled “Bilateral Amygdala,” suggesting it reflects neural activity (possibly fMRI or other brain imaging data), unlike the previous two which were based on self-reported ratings from control and brain-damaged participants.
- Single Heatmap: Unlike the previous image with two stacked heatmaps (control vs. brain-damaged), this image presents only one dataset.
- Color Arrows: While the previous image used arrows, this one uses a distinct color for each expression, making it easier to differentiate them visually.
- Interpretation Focus: This heatmap likely represents brain-based emotional processing, offering a physiological perspective rather than subjective perception.
Reproduced from “Recognition of facial emotion in nine individuals with bilateral amygdala damage,” R. Adolphs, D. Tranel, S. Hamann, A.W. Young, A.J. Calder, E.A. Phelps, A. Anderson, G.P. Lee, and A.R. Damasio, 1999 Neuropsychologia, 37, p. 1113, (https://doi.org/10.1016/50028-3932(99)00039-1). Copyright 1999 by Elsevier Science Ltd.
Based on Figure 11, the following conclusions can be made:
- Normal controls and brain-damaged controls showed similar performance. When shown an emotional facial expression, these participants reported the corresponding emotion to be most intense. For instance, when participants saw a disgusted face, they rated the face as intensely disgusting. This demonstrates that control participants were able to identify and recognize the emotional experience in others’ faces.
- When comparing bilateral amygdalae damage patients to the control groups, some of the emotion expressions do not show a corresponding highly intense emotion label. In particular, this is found for faces of fear, anger, and disgust. These findings suggest that impairment to the amygdala may hinder one’s ability to identify how much anger, fear, and disgust a person is showing, but this impairment does not exist for surprise, happy, and sad faces.
- These figures also show that control participants show overlap in their ratings of certain emotion labels for the same face. For example, when controls viewed an angry face, they reported high intensity for the emotions anger and disgust. This overlap is not as intense for bilateral damaged patients.
These initial findings show that amygdala damage does indeed impair recognition of fear in others. But this also shows that amygdala does control the identification of other emotions.
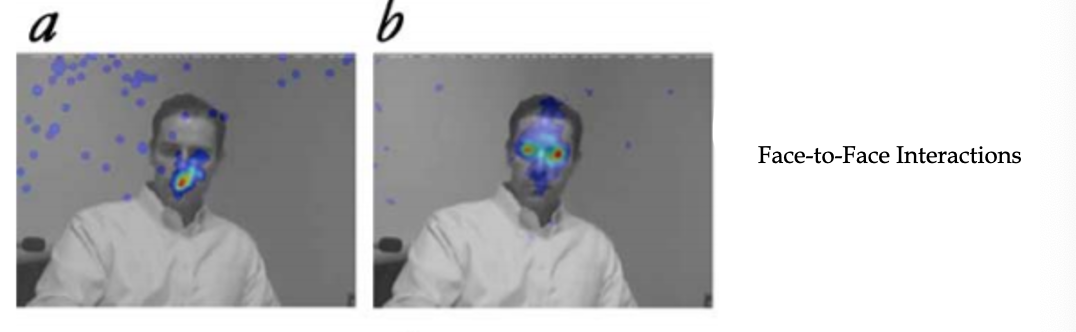
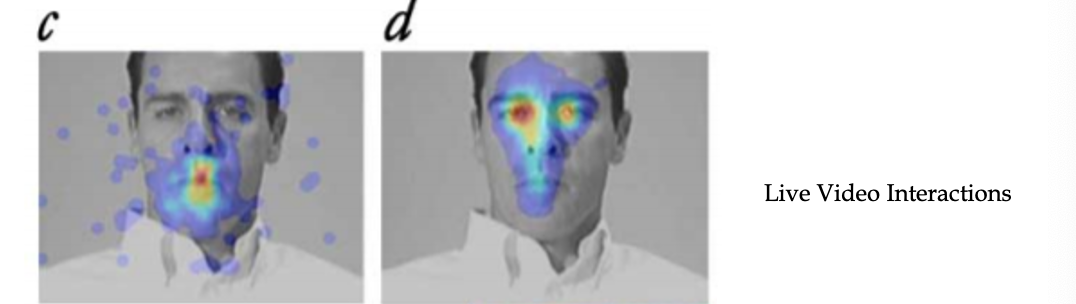
A follow-up study (Spezio et al., 2007) investigated the location of S.M.’s visual gaze when interpreting others’ facial expressions. Before discussing this study, it is important to note that people determine whether someone is experiencing fear mostly from their eyes. Even when someone is smiling, but their eyes are fearful – people interpret the facial expression as fear. In this study, S.M. and several healthy female controls engaged in a face-to-face or live video interaction with a professional actor who maintained a neutral facial expression. During the interaction, the participants wore an eye tracker. Findings (see Figure 12) showed that compared to controls, S.M. spent less time fixated on the actor’s eyes and more time staring at the actor’s mouth. This might suggest when the amygdala is damaged people identify the wrong facial expression because they are looking at the wrong part of the face. These finding have been replicated with still photos as well, but in the still photos S.M. focused more on the center of the face (Adolphs et al., 2005). Finally, although amygdala-damaged patients experience difficulty identifying emotions in facial expressions, their ability to identify an individual from their face is not hindered (Adolphs et al., 1994; 1995). Thus, if S.M. runs into her friend Wang, S.M. would think “This is my friend, Wang,” but she might have trouble interpreting Wang’s facial expressions.
Figure 12
Eye-tracking study comparing S.M. to healthy controls (Spezio et al., 2007
Long Description
The image displays a comparison from an eye-tracking study showing two monochrome photographs labeled “a” and “b” of a man seated against a plain background. In each photograph, heat maps indicating areas of focused gaze are overlaid. On the left, labeled “a,” the heat map shows concentrated areas around the mouth and scattered on the surroundings. On the right, labeled “b,” the heat map is centered around the eyes and mouth, indicating these as focal points of attention. The photographs are part of a study on eye-tracking involving individual S.M. and healthy controls. To the right side of the images, the text “Face-to-Face Interactions” is visible.
Long Description
The image is divided into two side-by-side sections labeled “c” and “d,” each depicting a grayscale photograph of a man’s face overlaid with different heat map patterns. In both sections, the man is wearing a white shirt and the background is plain gray. In section “c,” the heat map is concentrated around the mouth area, showing a vibrant red and orange center surrounded by cooler blue and purple shades, extending across the lower part of the face. Section “d” displays a heat map with broader coverage, primarily centered around the eyes, nose, and forehead, with intense red and orange hues around the eyes and nose, fading into blue and purple towards the edges. To the right, the words “Live Video Interactions” are printed in black.
Note. a and b = face-to-face interaction; c and d = over live video. S.M. data in a and c; healthy, female controls data in b and d. Red color indicates participants spent the most time looking at that area of the face. Reproduced from “Amygdala damage impairs eye contact during conversations with real people,” by M.L. Spezio, P.Y.S. Huang, F. Castelli, and R. Adolphs, 2007, Neuroscience, 27(15), p. 3996, (Amygdala Damage Impairs Eye Contact During Conversations with Real People) Copyright 2007 by Society for Neuroscience.
