
Chapter 6: Measuring and Manipulating Emotions
Measuring Emotions
This section focuses on the ways that researchers measure emotions and elicit emotions in the laboratory. The first half of the chapter will focus on ways that researchers measure participants’ emotional experiences, such as through self-report surveys or facial expression coding. The second half of the chapter will discuss the methods researchers use to manipulate emotions, such as by using scenarios or photos. As we discuss each method, identify the advantages and disadvantages of each method. The third section of this chapter focuses on the importance of emotion coherence when manipulating and measuring emotions.
Self-Report Measures
Self-report surveys can be used to measure many of the emotion components. Some self-report scales measure subjective feelings, such as the extent to which you feel anger or sadness. Self-report surveys could also measure conscious cognitive appraisals. For instance, “did you or someone else cause this event?” One self-report scale is the PANAS (Watson, Clark, & Tellegen, 1988), which measures PA and NA (see prior chapter). The Current Mood Questionnaire (CMQ; Feldman, Barrett & Russell, 1998) measures the activation and valence dimensions from Russell’s (1981) circumplex model. One disadvantage to these self-report scales is that participants must be able to read and introspect about their emotional states. The Self-Assessment Manikin (SAM; Bradley & Lang, 1994) was developed to solve this major criticism of common self-report scales. The SAM measures valence, arousal, and a third dominance dimension with facial expressions in clip art (See Figure 1). Thus, this self-report measure is language-free and can be completed by children who cannot yet read. A criticism of all self-report measures is that researchers are assuming participants have introspective access to understand their emotions accurately. In addition, sometimes people mislabel their emotion, as Schachter and Singer first discussed.
Figure 1
The Self-Assessment Manikin
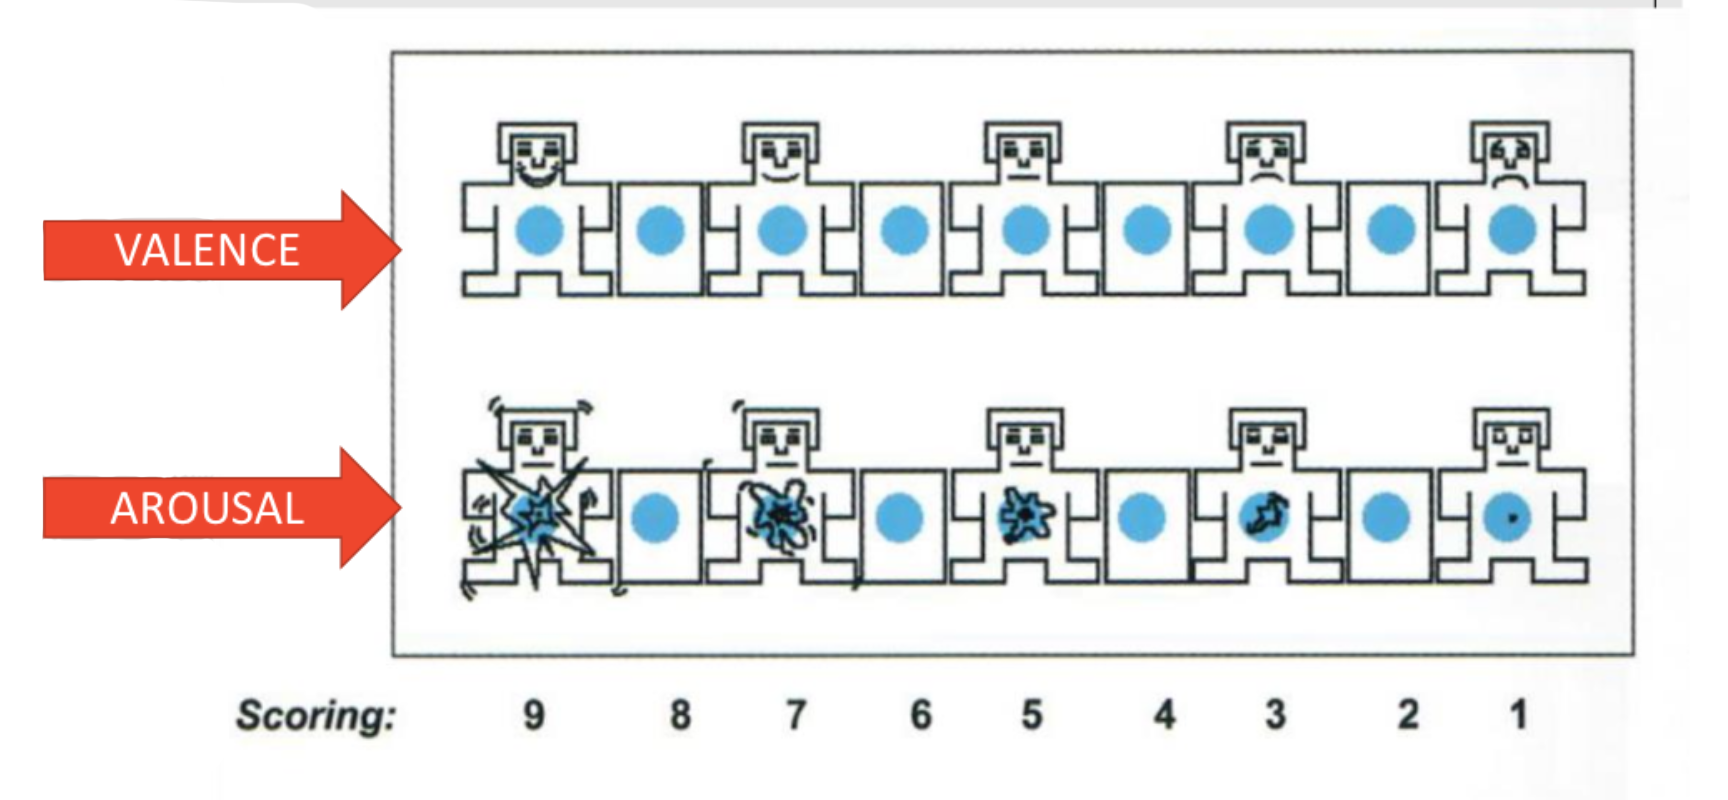
Long Description
The image features two horizontal rows of cartoon-like figures. The top row is used to represent “Valence,” with each figure displaying different facial expressions ranging from happy to sad. The figures have blue circles in the center and are accompanied by small rectangles between them. The bottom row represents “Arousal” and includes figures with varying symbols inside the blue circles, indicating levels of arousal. The figures here also have subtle expression changes. To the left, there are two large red arrows pointing right, labeled “VALENCE” and “AROUSAL” correspondingly. Below the rows is a numerical scoring scale from 9 to 1.
