
Chapter 5: Dimensional Models
Watson and Tellegen’s (1985) Circumplex Model
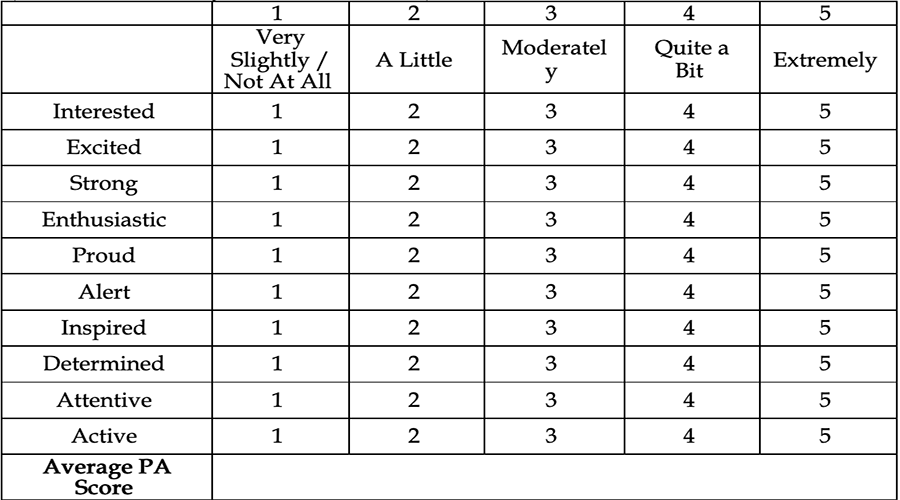
Positive Affect Scale-Momentary
Long Description
This table presents a Likert-style rating scale used to measure 10 different positive emotions. Each row represents one emotion, and each column represents a level of intensity from 1 to 5. The columns are labeled as follows:
- 1 = Very Slightly / Not At All
- 2 = A Little
- 3 = Moderately
- 4 = Quite a Bit
- 5 = Extremely
The emotions listed in rows are:
- Interested
- Excited
- Strong
- Enthusiastic
- Proud
- Alert
- Inspired
- Determined
- Attentive
- Active
For each emotion, respondents assign a rating from 1 to 5 based on how strongly they feel that emotion. The bottom row of the table indicates that an “Average PA Score” (Positive Affect Score) is calculated, likely by averaging the individual scores across all 10 emotions.
This type of scale is commonly used in psychology research to assess mood or affective state over a given period.
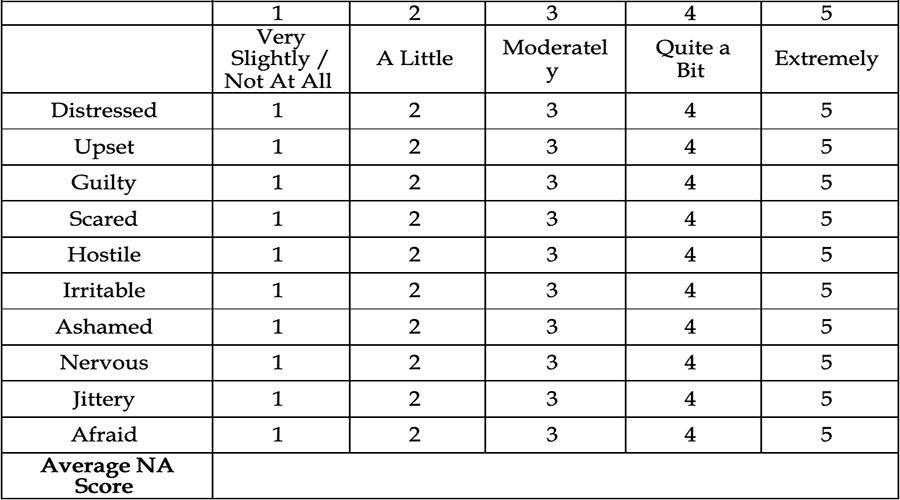
Negative Affect Scale-Momentary
Long Description
Rating scale table for 10 negative emotions from 1 (Very Slightly/Not at All) to 5 (Extremely), used to compute an average NA (Negative Affect) score.
Long Description:
This table shows a Likert-style rating scale designed to measure 10 distinct negative emotions. Each emotion is listed in a separate row, and respondents select a rating from 1 to 5 based on how intensely they experience each feeling.
The scale is defined as follows:
- 1 – Very Slightly / Not At All
- 2 – A Little
- 3 – Moderately
- 4 – Quite a Bit
- 5 – Extremely
Emotions listed:
- Distressed
- Upset
- Guilty
- Scared
- Hostile
- Irritable
- Ashamed
- Nervous
- Jittery
- Afraid
Each row contains numbers from 1 to 5, corresponding to the respondent’s self-rated level of that emotion. The final row at the bottom indicates that the “Average NA Score” (Negative Affect Score) is computed by averaging the ratings across all 10 items.
This table format is typical of affective measurement tools such as the Positive and Negative Affect Schedule (PANAS) and is used in psychological assessments to quantify emotional states.

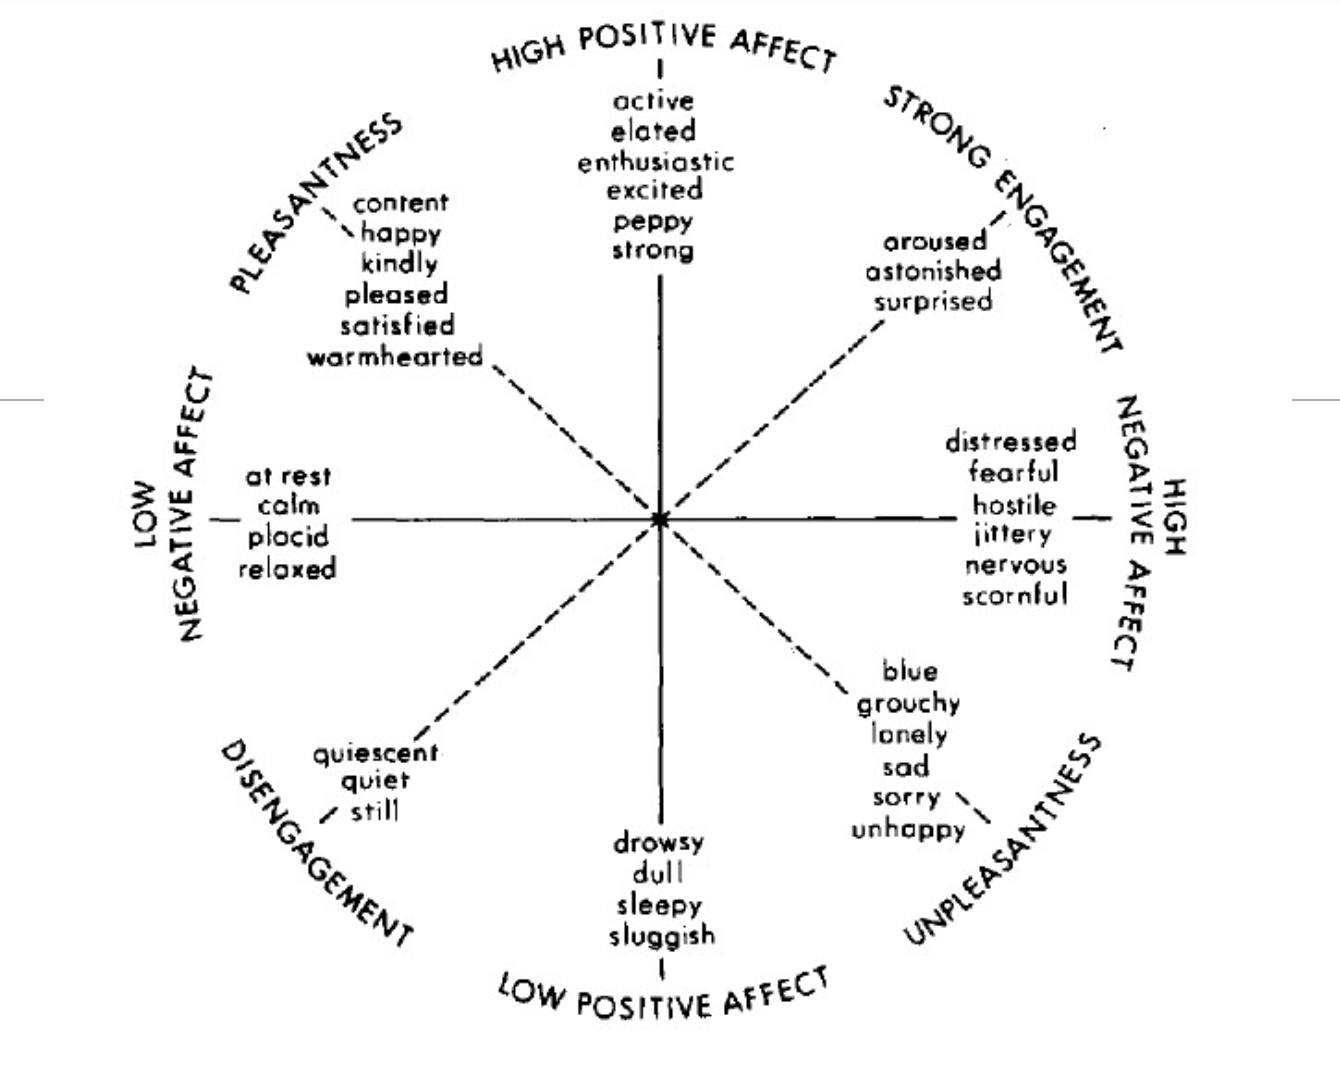
Watson and Tellegen (1985) conducted similar studies to Russell and Barrett (1999). Their findings suggested that the lines identified by Russell and Barrett were not placed through the greatest cluster of points. So, Watson and Tellegen (1985) rotated Russell’s (1980) circumplex 45 degrees (see below) and drew two new dimensions through the greatest cluster of points, which they labeled High Positive Affect and High Negative Affect.
Figure 7
Watson and Tellegen’s (1985) 45° Rotation of Russell’s (1980) Circumplex
Long Description
The image is a circular diagram that illustrates different affective states positioned around two intersecting axes. The vertical axis ranges from “Low Negative Affect” at the bottom to “High Positive Affect” at the top. The horizontal axis ranges from “Pleasantness” on the left to “Unpleasantness” on the right. The circle is also divided into quadrants by diagonal lines, indicating “Disengagement” at the bottom left, “Strong Engagement” at the top right, “Low Positive Affect” at the bottom, and “High Negative Affect” at the right side. Each section contains words that describe emotions associated with varying degrees of these affective states. For example, the upper right section labeled “High Positive Affect, Strong Engagement” lists emotions such as “active,” “elated,” and “enthusiastic.” The bottom right section signifies “Low Positive Affect” with words like “drowsy” and “dull.” The left side features “Low Negative Affect, Disengagement” with terms like “at rest” and “calm.” The right side under “High Negative Affect” includes emotions such as “distressed” and “fearful.”
Rotating Russell’s (1980) circumplex resulted in eight octants subsumed by four dimensions: pleasantness, engagement, positive affect, and negative affect. Pleasantness/unpleasantness and engagement/disengagement are bipolar measures, whereas positive affect and negative affect are unipolar dimensions (although Watson and Tellegen state they are bipolar dimensions as well). Pleasantness ranges from moderately arousing pleasant emotions to moderately arousing negative emotions. They are moderately arousing emotions because these emotions are located between strong engagement and disengagement. The engagement dimension measures high to low arousing emotions that are moderately pleasant or unpleasant. High Negative Affect (NA) and High Positive Affect (PA) represent highly activated positive and negative emotions because PA and NA are located closest to engagement. Specifically, High NA is feeling unpleasant, highly arousing emotions. High PA is feeling pleasant and highly activated emotions. Later, Positive Affect and Negative Affect were renamed Positive Activation and Negative Activation to emphasize the terms represent highly activating emotions.
Relationships between emotions are determined by how close in space the octants of each emotion are. Table 1 explains how to interpret the correlational relationships based on octant location(s).
Table 1
Correlational Relationship between Emotion Words based on Octant Location
| Octant Location of Emotion Words | Relationship |
|---|---|
| Emotions words located in same octant | Strongly, positively correlated |
| Emotion words in adjacent octant | Moderately, positively correlated |
| Emotion Words 90°apart | Uncorrelated |
| Emotion Words 180° apart | Strongly, Negatively correlated |
Watson and Tellegen (1985) found that self-reports of emotions clustered mostly around High PA and High NA. Thus, they concluded that PA and NA are the only two dimensions of the model and are most representative of true emotions. So, they believe the important emotions are all high in arousal. Because PA and NA are 90 degrees from each other, PA and NA are uncorrelated with each other. This means an individual could experience High PA and High NA at the same time. In fact, Watson and Tellegen (1985) suggest that mixed emotions occur in the octants between High PA and High NA. It is important to note that this model does not allow happiness and sadness to co-occur.
So, what about the low poles of PA and NA? The low poles represent the absence of PA and NA. Low NA would be the absence of highly arousing negative emotions and Low PA would be the absence of highly arousing positive emotions. So, low NA represents pleasant emotions that are low in arousal. This is because low NA is closest in space to the pleasantness and disengagement dimensions. Similarly, low PA would be the presence of positive deactivation. So, low PA represents unpleasant emotions that are low in arousal. This is because low PA is closest in space to unpleasantness and disengagement.
In this model, PA and NA are usually negatively correlated, such that an increase in negative affect should decrease positive affect. But these dimensions may also be uncorrelated or positively correlated. It is important to point out that researchers disagree over whether PA and NA are unipolar or bipolar. Watson and Tellegen (1985) believe that PA and NA are bipolar – because an increase in high PA results in a decrease of unpleasant, low arousal emotions. Yet, some researchers suggest that PA and NA are unipolar. For instance, PA could range from the presence of highly activating positive emotions (e.g., excited, elated) to the absence of highly active positive emotions (e.g., dull, sluggish).
PA and NA are measured using the PANAS-Momentary (Watson et al., 1988), which you completed earlier. One criticism of this theory is that some of the emotion words for high PA and NA seem like motivational states (e.g., attentive, alert), while others seem like personality traits (e.g., determined, hostile) and still others like moods (e.g., irritable).
